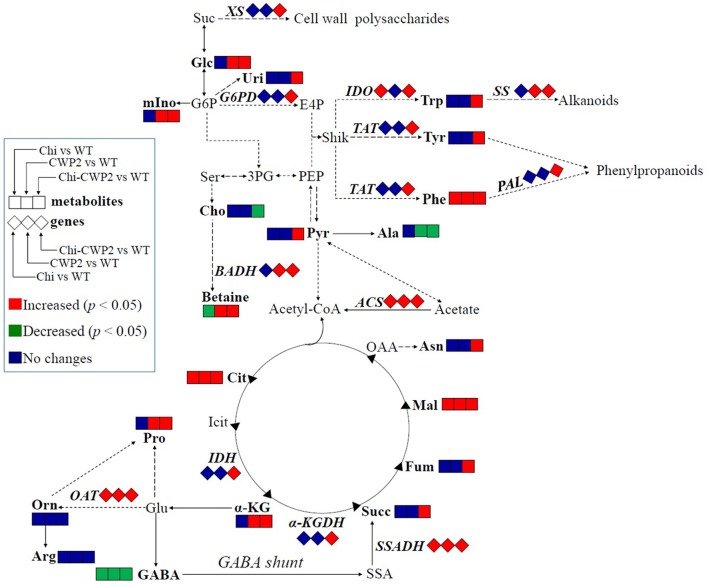
Figure 5.
FG-induced metabolic changes in wild-type (WT) and transgenic A. thaliana expressing Chi, CWP2, and Chi-CWP2 highlighted by changes in metabolites and gene expression levels. Identified metabolites and measured genes were in bold letters. Red and green symbols denoted significant increases and decreases (p < 0.05), respectively. Suc, sucrose; Ala, alanine; Arg, arginine; Asn, asparagine; α-KG, α-ketoglutarate; Cho, choline; Cit, citrate; E4P, erythrose-4-phosphate; Fum, fumarate; GABA, γ-aminobutyrate; G6P, glucose-6-phosphate; Glc, glucose; Glu, glutamate; Icit, isocitrate; Mal, malate; mIno, myo-inositol; OAA, oxalacetate; Orn, ornithine; PEP, phosphoenolpyruvate; 3PG, 3-phosphoglycerate; Pyr, pyruvate; SSA, succinate semialdehyde; Ser, serine; Shik, shikimate; Succ, succinate; Trp, tryptophan; Tyr, tyrosine; Phe, phenylalanine; Uri, uridine.

