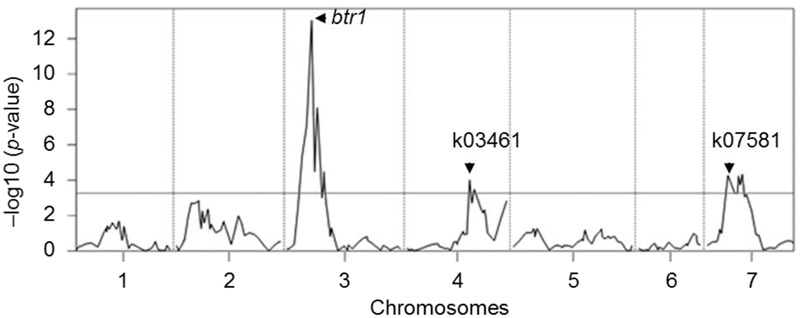
FIGURE 2.

QTL mapping for rachis brittleness in einkorn wheat. The mean (across two seasons) rachis brittleness score was used to represent the trait in the analysis. The horizontal line represents the LOD threshold. The btr1 (dCAPS), k03461, and k07581 are molecular markers linked to the QTLs.
