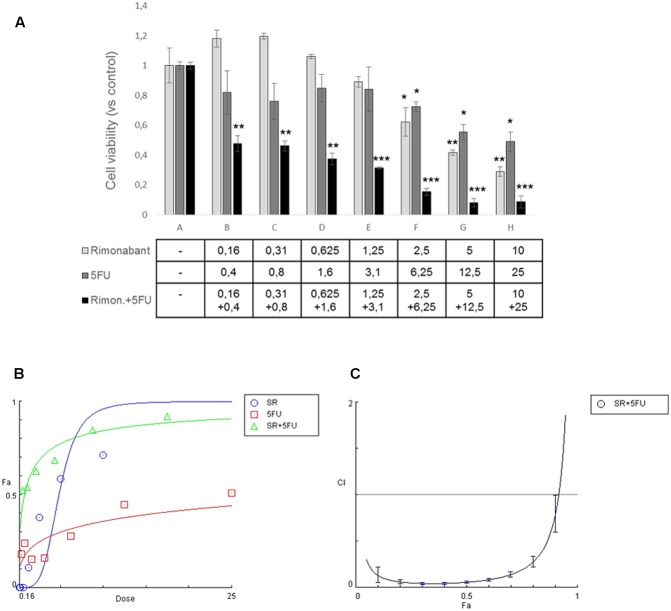
FIGURE 2.
(A) MTT assay performed in HCT116 cells treated with indicated concentrations of Rimonabant (μM) or 5FU (μM) alone or in combination; data are expressed as means ± SD of 3 independent experiments performed in triplicate and reported as ratio vs. the vehicle control (∗p < 0.05, ∗∗p < 0.01, ∗∗∗p < 0.001 vs. control). (B) Representative dose-effect curve performed at least twice in triplicate with CompuSyn software and showing the dose of the drug vs. the fraction of cells affected/killed (Fa) by Rimonabant (SR) or 5FU used alone or combined at constant molar ratio 1:2.5. (C) Combination Index plot (Fa-CI plot) computed by Compusyn software from the affected fraction (Fa) obtained at each dose of the drugs used in combination, at constant molar ratio 1:2.5. Representative experiment (carried out at least twice) is reported.

