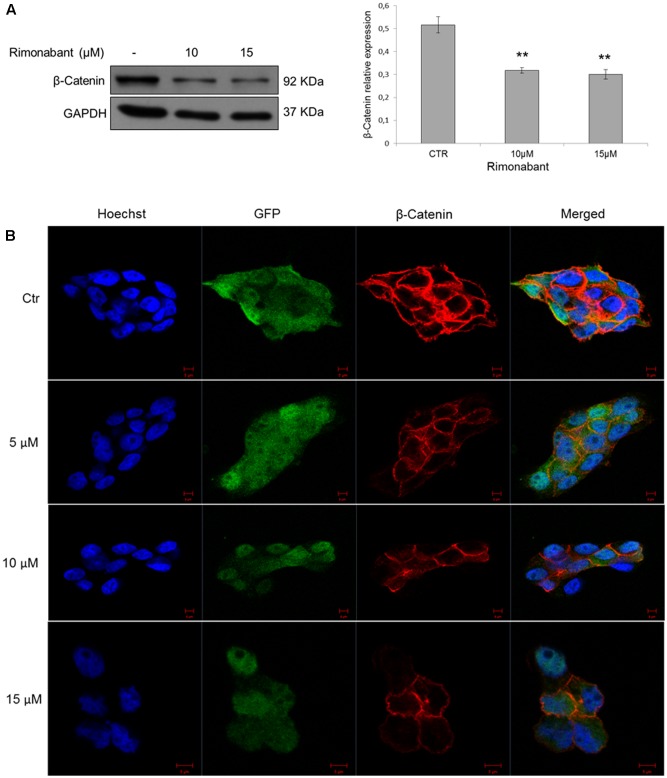
FIGURE 5.
(A) Representative Western blot analysis (left) of β-Catenin in total protein lysates from GTG7 cells. Right, densitometric analysis of β-Catenin normalized vs. GAPDH, used as loading control. Results are expressed as means ± SD of 3 independent experiments performed at least in duplicate (∗∗p < 0.01). (B) Confocal microscopy analysis of β-Catenin (red) in GTG7 cells treated with Rimonabant at indicated doses for 18 h. Nuclei were stained with Hoechst (blue fluorescence); GFP (green); Scale bar = 5 μm.

