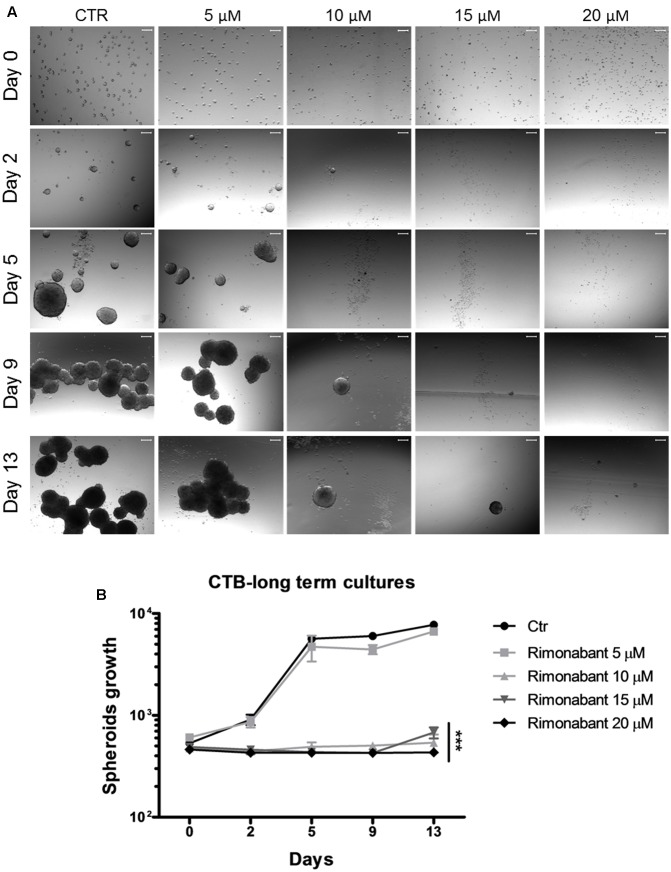
FIGURE 6.
(A) Representative images of GTG7 clones after 24 h of treatment with Rimonabant (or vehicle control) starting from day 0 (corresponding to the end of treatments) and until day 13. Growth of spheroidal clones was monitored in three independent experiments in triplicate. Scale bar = 100 μm. (B) Cell Titer Blue (CTB) colorimetric assay in GTG7 treated for 24 h, as described. Data are expressed as mean ± SD of at least three independent experiments in triplicate (∗∗∗p < 0.005 vs. control).

