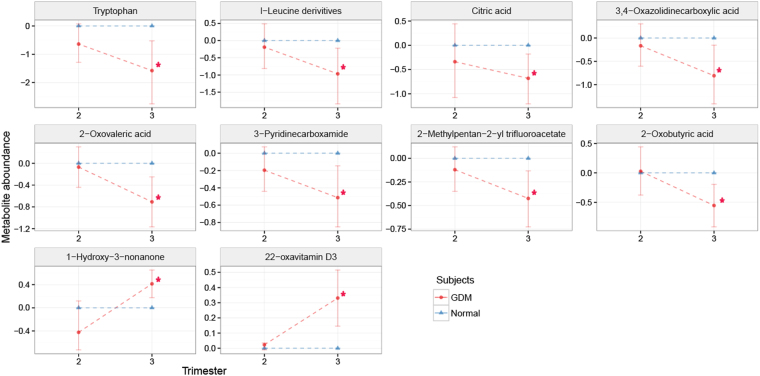
Figure 5.
The ratio of hair metabolite levels collected from normal pregnancies as opposed to gestational diabetes mellitus (GDM) at second trimester and third trimester. Red circles represent metabolite level in maternal hairs collected from GDM. Blue triangles represent metabolite level in maternal hairs collected from normal pregnancies that were set to 0. The metabolite levels in GDM relative to the normal pregnancy were adjusted using log 2 scale. Standard deviations are shown by vertical lines. Red asterisks (*) indicate metabolites with p-values and q-values less than 0.01 and 0.17, respectively.

