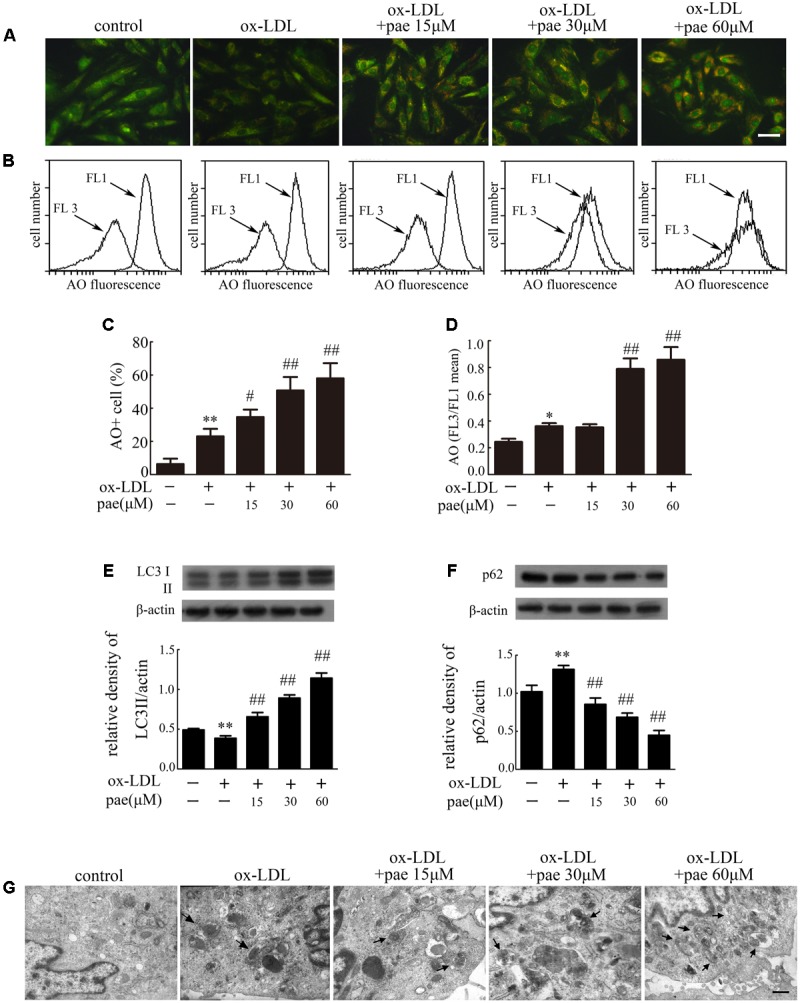
FIGURE 5.

Paeonol induced autophagy in VMSCs. Cells were treated with different concentrations of Paeonol in the absence or presence of ox-LDL (50 μg/mL) for 24 h. The AO-staining in cells was demonstrated by fluorescence microscopy, Bar = 50 μm (A) and flow cytometry (B). (C) Autophagic values were calculated as the percentage of AO+ cells relative to the total number of cells. (D) Intracellular acidification was calculated by red-to-green (FL3/FL1) mean fluorescence intensity. (E) LC3 processing and (F), p62 levels in VSMCs were estimated by western blot assay. Data are the mean ± SD, n = 3. ∗∗p < 0.01 vs. control group. #p < 0.05, ##p < 0.01 vs. ox-LDL group. (G) Representative TEM images of VSMCs. Arrows indicated the autophagosome. Bar = 500 nm.
