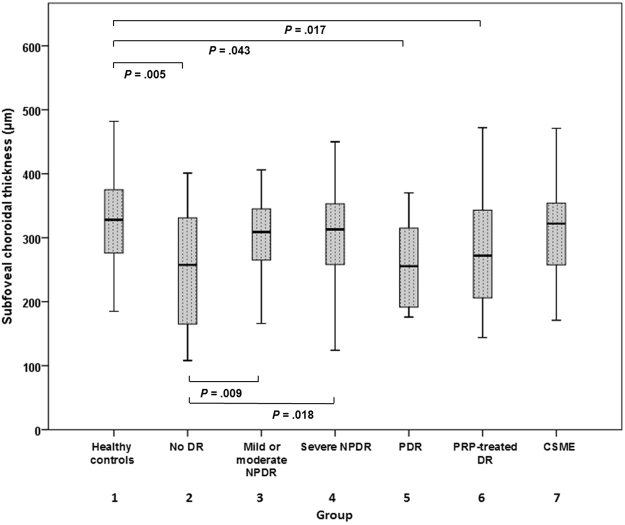
Figure 2.
Subfoveal choroidal thickness in each group. The mean subfoveal choroidal thicknesses in groups 1–7 were 320.00 ± 77.92, 258.13 ± 89.02, 310.22 ± 72.41, 304.53 ± 69.26, 258.75 ± 73.29, 276.29 ± 79.51, and 312.58 ± 89.59, respectively. A crude analysis of these data suggested that eyes of diabetic patients exhibited a lower CT than eyes of healthy controls. Among the eyes of diabetic patients, the lowest CT values were observed in the PDR group. The statistical significances are shown in the figure. Note: CSME, clinically significant macular edema; CT, choroidal thickness; DR, diabetic retinopathy; NPDR, non-proliferative diabetic retinopathy; PDR, proliferative diabetic retinopathy; PRP, panretinal photocoagulation.

