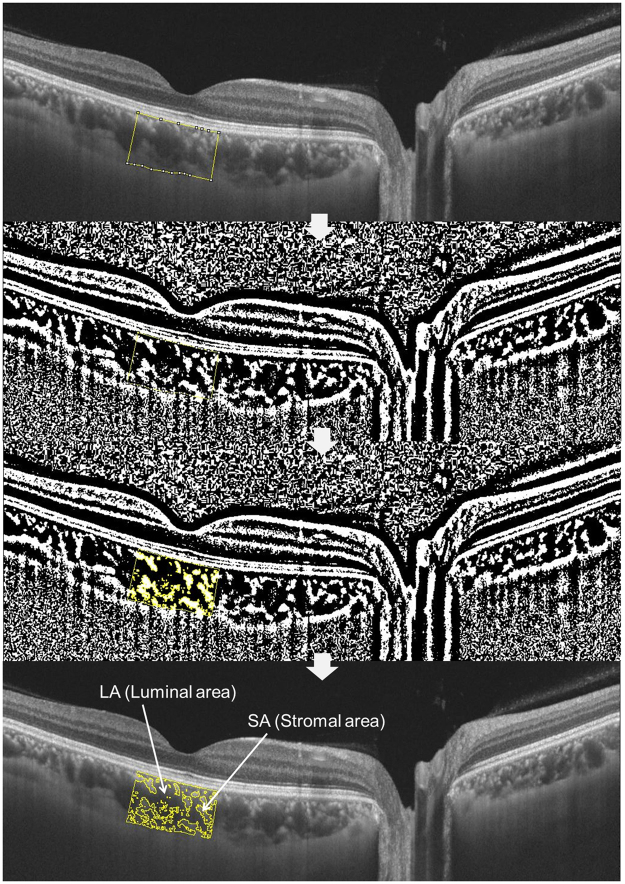
Figure 3.
Representative image processing to obtain choroidal vascularity index. Using the polygon selection tool, the total choroidal area (TCA) for the subfoveal region within a width of 1500 μm (750 μm either side of the fovea) was selected, and regions of interest (ROIs) were added to the ROI manager. After converting the image to an 8-bit image, a Niblack autolocal threshold tool was applied, which yielded the mean pixel value with the standard deviation (SD) for all the points. The luminal area (LA) was highlighted by applying the color threshold, and subsequently added to the ROI manager. To determine the LA within the initially selected polygon, both the areas in the ROI manager were selected and merged via an “AND” operation. This composite third area was added to the ROI manager. The first area represented the total of the choroid selected or TCA, and the third composite area represented the vascular area or LA. The ratio of the LA to the TCA was termed the CVI. (LA + SA = TCA).

