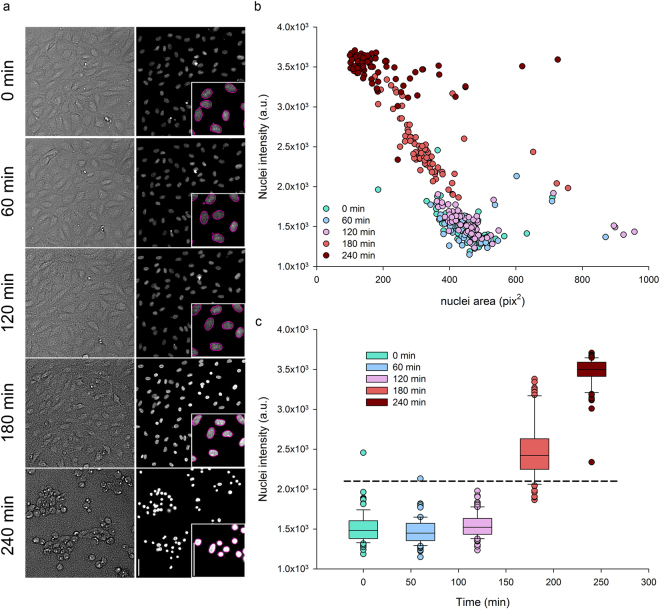
Figure 1.
Smaller and brighter cell nuclei reflect P. aeruginosa induced cell-damage. Human primary endothelial cells (HUVECs) were infected with P. aeruginosa and monitored at different stages of infection by live-imaging microscopy with vital-Hoechst nuclear stain. (a) Cell surface and cell nuclei observed in transmitted light and by fluorescent labelling, upper and lower images respectively, in the same field at one hour intervals. Nuclei from the same set of images were automatically segmented (insert – magenta outlines). The scale bars shown on the last nuclei image correspond to 50 µm. (b) The area and fluorescence intensities of each segmented nucleus were plotted. Data obtained from different time points are represented in colors, from green (0 min) to dark red (240 min). a.u. = arbitrary units. (c) Nuclear staining intensities of cells at different time points of infection are represented in box plots. Whiskers indicate the 10th and 90th percentiles; the top and bottom lines represent the 25th and 75th percentiles; the middle line and dots respectively show median and outliers. Intensities from the three first time points are statistically different from those of the two last time points (one way ANOVA, P < 0.05). The horizontal dashed line represent a threshold that could discriminate between normal and bright nuclei. In (b) and (c), n = 70 cells at each time point.

