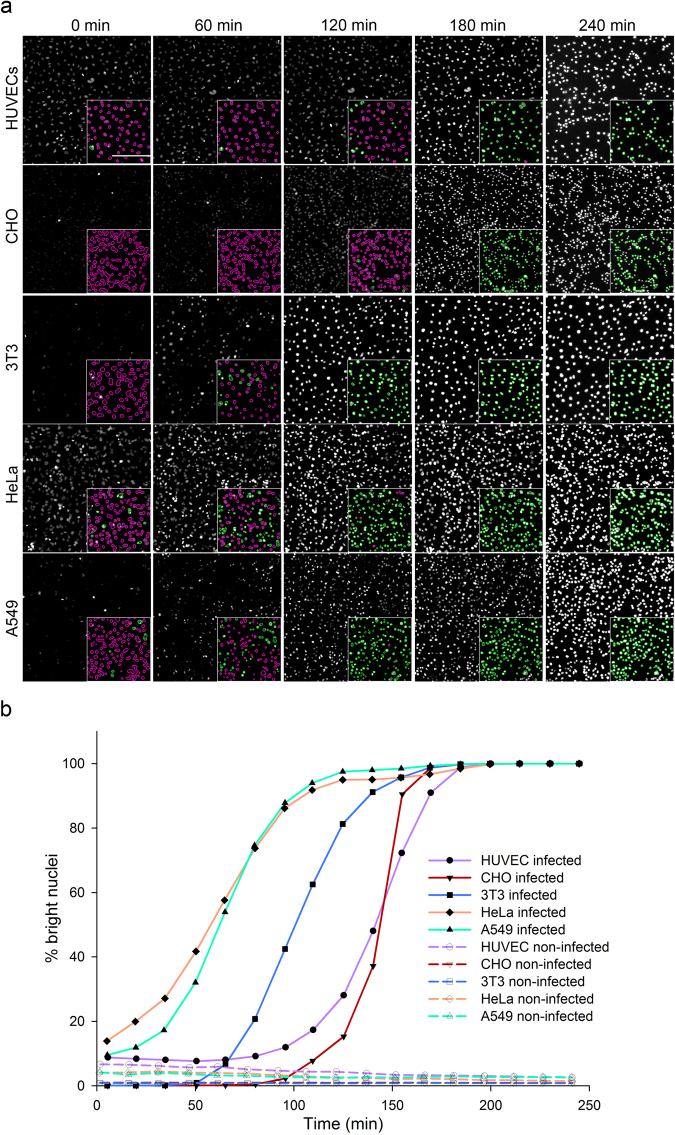
Figure 2.
Live-imaging quantification of P. aeruginosa cell infection by fluorescence intensity measurement of Hoechst-labelled nuclei. HUVEC, CHO, 3T3, HeLa and A549 cells were labelled with vital-Hoechst prior to infection with P. aeruginosa and monitored by microscopy at a 5x magnification. (a) Cell nuclei observed by fluorescent labelling and automatically segmented (insert). Nuclei with intensities below a fixed threshold were delineated in magenta while those above the threshold were delineated in green. The scale bar shown on the first image of the HUVECs cells corresponds to 200 µm. (b) Kinetic plots representing the percentage of nuclei with intensities above the thresholds in the images taken every 15 min.

