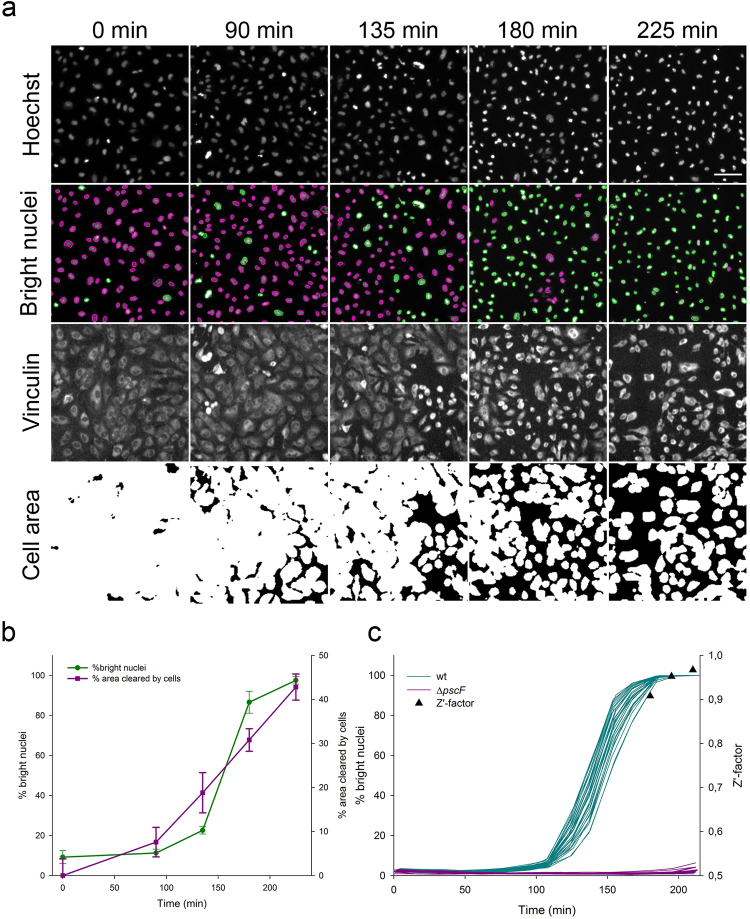
Figure 3.
Comparison of the CLIQ-BID and “cell area” methods. HUVECs were infected with P. aeruginosa for different durations; images of the nuclei were acquired before cell fixation, immunostaining and acquisition of cell area images. (a) Image sets at different time points for (i) Hoechst: cell nuclei; (ii) Bright nuclei: nuclei automatically segmented and sorted for intensities below (magenta) or above (green) a fixed threshold; (iii) Vinculin: cell area detected with a cytoplasmic vinculin staining; iv) Cell area: automated thresholding of the immunostaining allowing the calculation of the field area covered by the cells. The scale bar shown on the last nuclei image corresponds to 50 µm. (b) Plots of the percentage of nuclei with intensities above the thresholds and of the percentage of area cleared by the cells after different infection durations. Error bars represent the standard deviation (n = 8).

