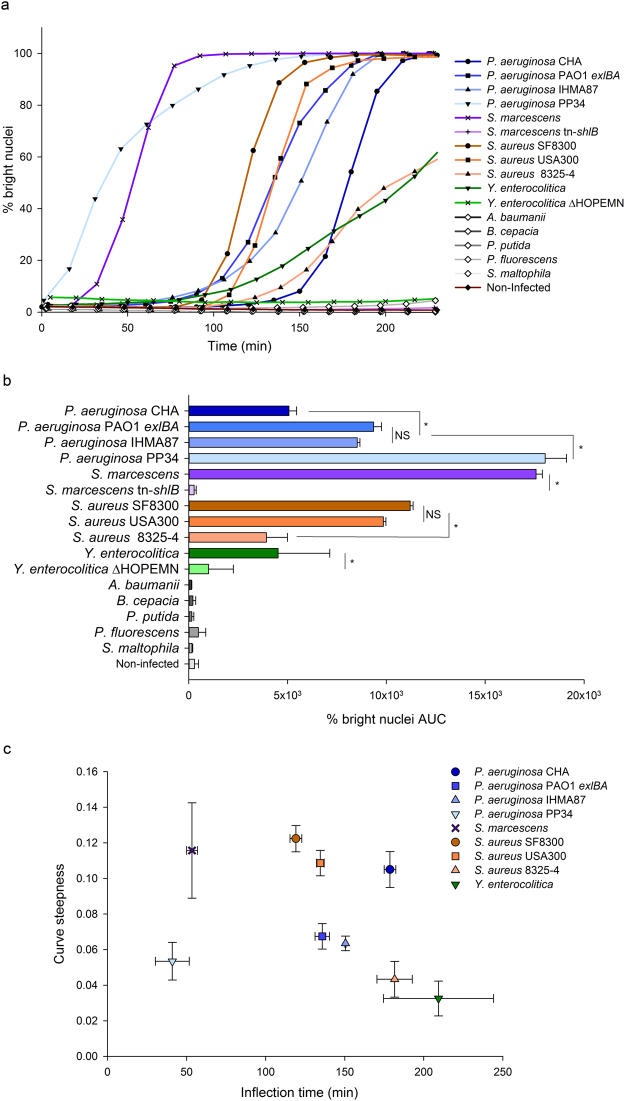
Figure 5.
Comparison of cell damage kinetics with different bacteria. HUVECs were infected with 16 different bacteria and monitored by live-imaging. The percentages of bright nuclei were used to derive kinetics plots (a) and the corresponding Area Under the Curves (AUC) (b). Each point in the kinetics plots corresponds to the means of triplicates and AUC histograms represent the means of the AUCs obtained for the kinetics of each replicate. Error bars represent the standard deviation (n = 3). Stars indicate statistically significant differences between strains of the same species and NS a non-significant difference (one-way ANOVA, P < 0.05). Each of the kinetics plot replicates obtained with different bacterial species inducing “bright nuclei” were fitted with sigmoid model curves and the inflection point and curve steepness were calculated and represented as XY pairs (c). Means and standard deviations are represented.

