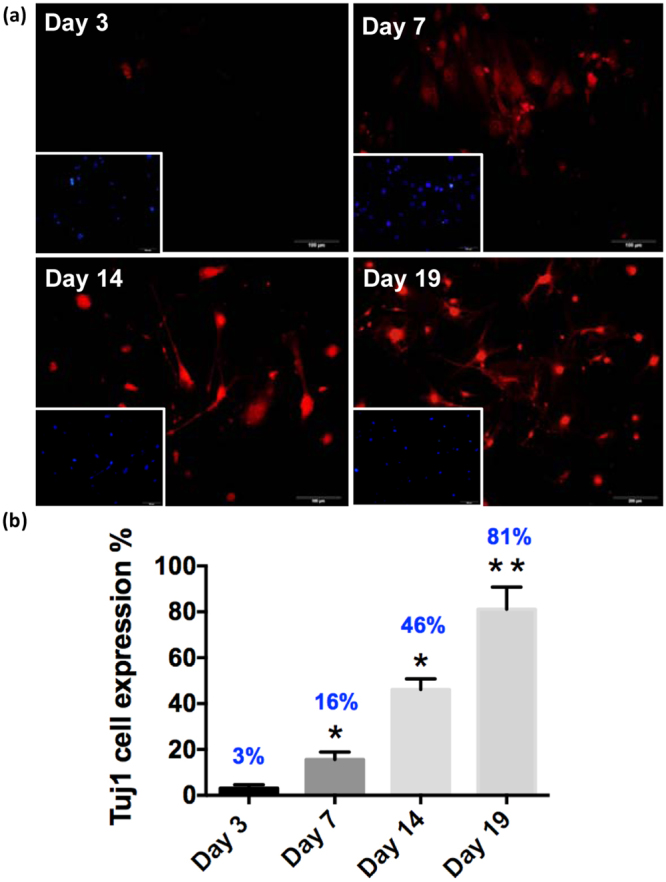
Figure 5.

(a) Immunofluorescence staining was used to examine the expression of the Neuron-specific class III beta-tubulin (Tuj1, red) in pABM-I@M treated MFs after transfection for 3, 7, 14 and 19 days. (b) The image analysis-based quantification of the number of Tuj1-expressing cells was normalized to the number of nuclei which were counterstained with 4′,6-diamidino-2-phenylindole (DAPI, blue). Scale bars: 100 μm. Data are means standard deviation of three independent calculation of cell number (200). The asterisk (*) indicate statistical differences (p < 0.05) compared with control, and **indicate p < 0.001.
