Fig. 5.

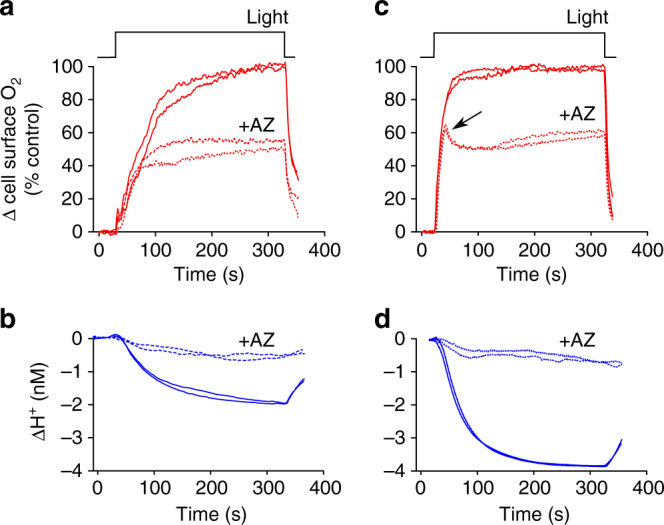
The cell surface microenvironment under low DIC conditions. a Detailed view of the increase in cell surface [O2] following illumination of an O. sinensis cell in ASW media containing 2 mM DIC at pH 8.0 with or without the addition of 100 µM AZ. The O2 traces are shown as % of the untreated control. b The decrease in cell surface [H+] for cells shown in a. c Cell surface [O2] around an O. sinensis cell in ASW media containing 0.5 mM DIC at pH 8.0 with or without the addition of 100 µM AZ. In the presence of AZ at 0.5 mM DIC, the initial rise in [O2] at the cell surface is very similar to the untreated control, but this rate cannot be sustained and falls to a lower level. d The decrease in cell surface [H+] for cells shown in c. The depletion of [H+] at the cell surface is much greater at 0.5 mM DIC than at 2 mM DIC. Representative traces are shown from two individual cells, n = 7 cells examined
