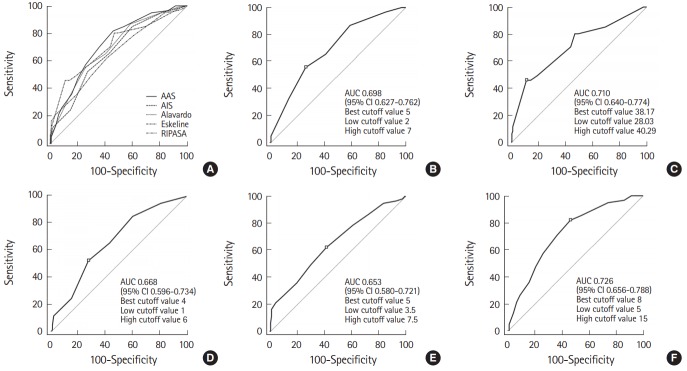
Fig. 2.
Receiver operating characteristic (ROC) curve and area under the curve (AUC) of each clinical score for the diagnosis of adult appendicitis. (A) ROC of all scores, (B) ROC of Alvarado score, (C) ROC of Eskelinen score, (D) ROC of appendicitis inflammatory response (AIR), (E) ROC of Raja Isteri Pengiran Anak Saleha Appendicitis (RIPASA), and (F) ROC of adult appendicitis score (AAS).
There was no statistical difference between the scores by pairwise comparison of the ROC curves (P>0.05). P-values were calculated using MedCalc ver. 7.4 (MedCalc Software, Mariakerke, Belgium) to compare AAS with other scores. The square mark on each ROC curve indicates the best cutoff value for each clinical score. CI, confidence interval.

