Figure 2.
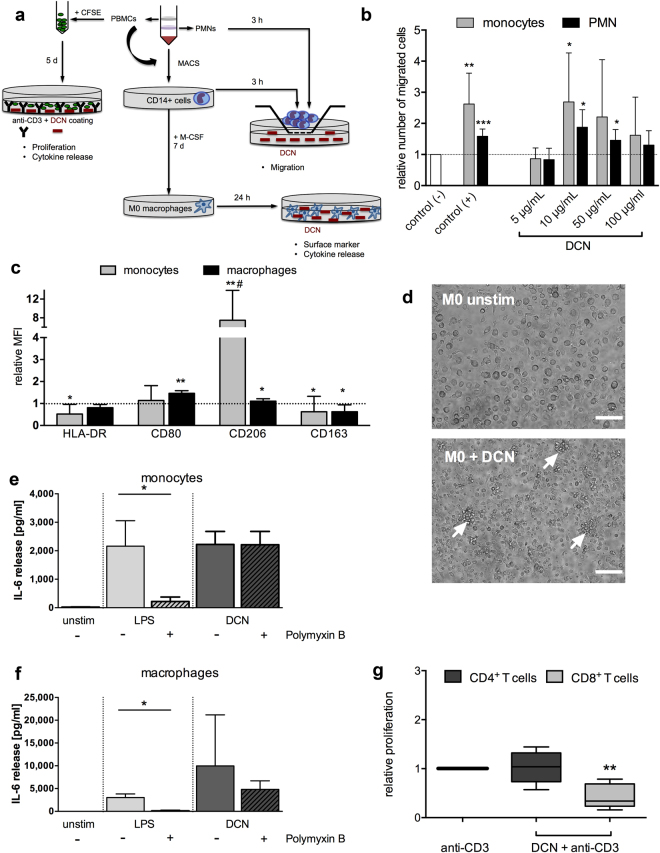
Evaluation of human immune responses induced by human recombinant DCN in vitro. (a) The experimental design for the immunological characterization of DCN including: isolation of human PBMCs and labeling with CFSE for immune cell proliferation analysis, isolation of PMNs, CD14+ monocytes and M0 type macrophages for testing migration and changes in surface marker expression and cytokine release by flow cytometry and ELISA. (b) Migration of CD14+ monocytes and PMNs towards different DCN concentrations or 10% human serum (positive control) after 3 hours. *P < 0.05 **p < 0.01 ***p < 0.001 relative to the control (−) with one-way ANOVA and Dunnet’s post test; n = 3 with 9 single values. (c) Classical cell surface markers were determined after co-culture of CD14+ monocytes for 7 days or M0 type macrophages for 24 hours with 50 µg/mL DCN, and the relative mean fluorescence intensities (MFI) ± SD are shown in comparison with the untreated control (set as 1). Data were analyzed for each marker by a Kolmogorov-Smirnov-test; *p < 0.05, **p < 0.01 compared to control or two-way- ANOVA with Sidak’s post test; #p < 0.001 comparing both cell types; n = 5. (d) Representative images of unstimulated M0 type macrophages (M0 unstim) and DCN-stimulated macrophages (M0 + DCN) with cell cluster formation (white arrows). Scale bars equal 100 µm. Release of IL-6 in co-cultures of monocytes (e) and M0 macrophages (f) with either DCN (50 µg/mL) or lipopolysaccharide (LPS; 10 µg/mL) alone, or after pre-incubation with Polymyxin B (50 µg/mL) compared to unstimulated (unstim) cultures. Data were analyzed by Mann-Whitney U test; *p < 0.05; n = 5. (g) Proliferation of T cells after a 5 day-co-culture of human PBMCs with either low-dose anti-CD3 alone or DCN combined with anti-CD3 (DCN + anti-CD3) was tested in a CFSE-based assay and measured by flow cytometry. The relative proliferation of CD4+ and CD8+ T cells relative to the anti-CD3-stimulated control (set as 1) is shown. Data were analyzed by Kruskal-Wallis test with Dunn’s post test; **p < 0.01; n = 6.

