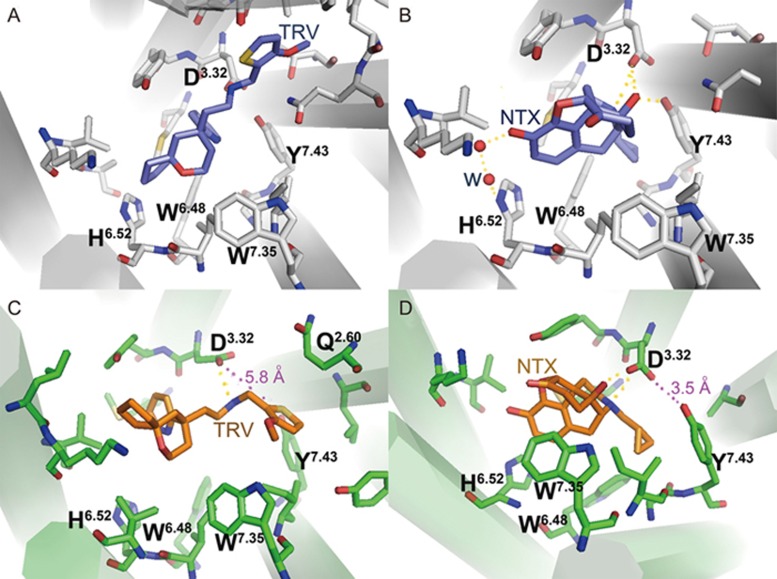
Figure 2.
Presentation of the initial docking poses (A, B), key residues and final 300 ns frames (C, D) in the TRV130-μ-OR and NTX-μ-OR complexes. The backbones of the proteins are colored green (300 ns) and gray (initial), whereas those of the ligands are colored orange (300 ns) and slate-blue (initial). The hydrogen bonding interactions are shown as yellow dotted lines, whereas the measured distances are shown as purple dotted lines.

