Figure 5.
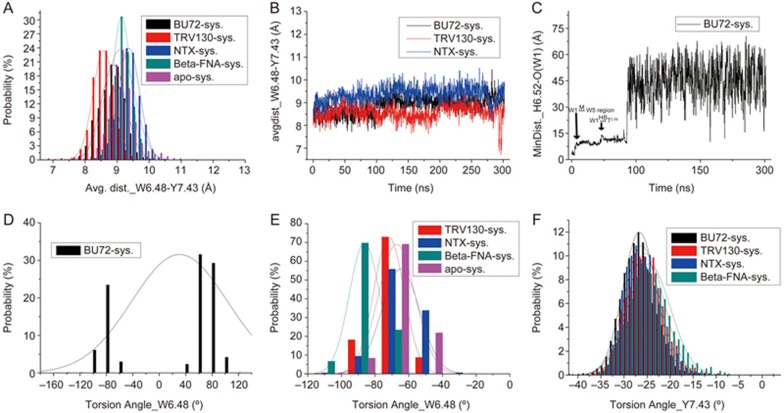
The average distance distributions between the activation switch residues W6.48 and Y7.43 in the five systems (A) and evolutions of these average distances in the BU72, TRV130 and NTX systems (B). (C) Detailed evolutions of the minimum distances between residue H6.52 and water W1 in the BU72 system. (D, E) The distributions of the side chain torsion of “switching” residue W6.48 in the five systems. (F) The distributions of the side chain torsion of important residue Y7.43 in the four ligand-bound systems.

