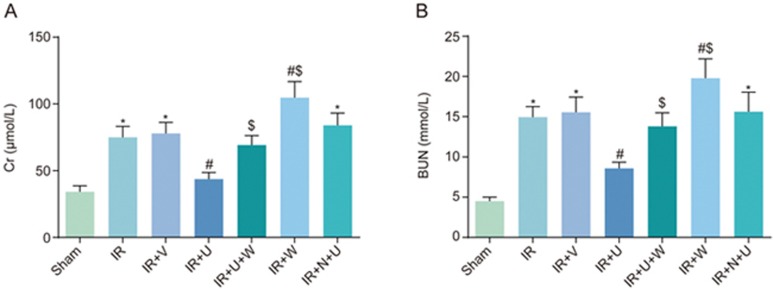
Figure 1.
Comparison of Cr (A) and BUN (B) levels among the sham, IR, IR+V, IR+U, IR+U+W, IR+N+U and IR+W groups. *P<0.05 vs the sham group. #P<0.05 vs the IR group. $P<0.05 vs the IR+U group. Cr, creatinine; BUN, blood urea nitrogen; IR, ischemic reperfusion; V, normal saline; N, KOR antagonist Nor-BNI; U, KOR agonist U50448H; W, PI3K inhibitors wortmannin.

