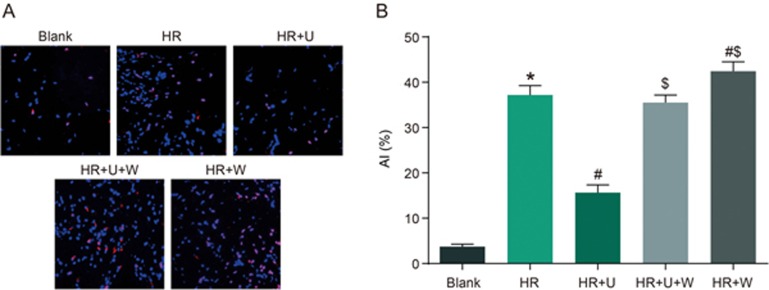
Figure 8.
Comparison of AI after HR of renal tubular epithelial cells among the blank, HR, HR+U, HR+U+W and HR+W groups. *P<0.05 vs the sham group. #P<0.05 vs the HR group. $P<0.05 vs the HR+U group. AI, apoptotic index; HR, hypoxia-reoxygenation; U, KOR agonist U50448H; W, PI3K inhibitors wortmannin.

