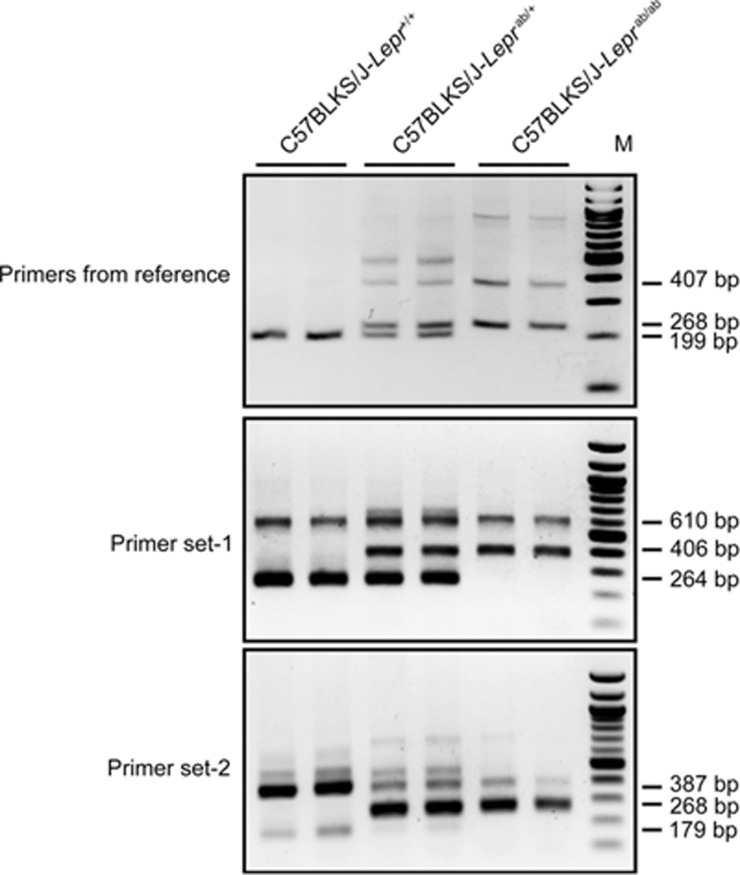
Figure 2.
Comparison of genotyping results by using primers from reference17 (upper panel) and our primer set-1 and primer set-2 (middle and bottom panels). Since the primers from reference produced two bands similar in size (268 bp for T-allele band and 199 bp for G-allele band), we have to use 3% agarose gel and longer running time for a clear separation. While both of our primer sets produce well separated PCR products, which can be easily resolved by 1.5% agarose DNA gel with regular running time. The DNA templates are from wild type mice, db/+ heterozygous mice and db/db homozygous mice. Each lane represents one independent sample. M: 100 bp DNA ladder.

