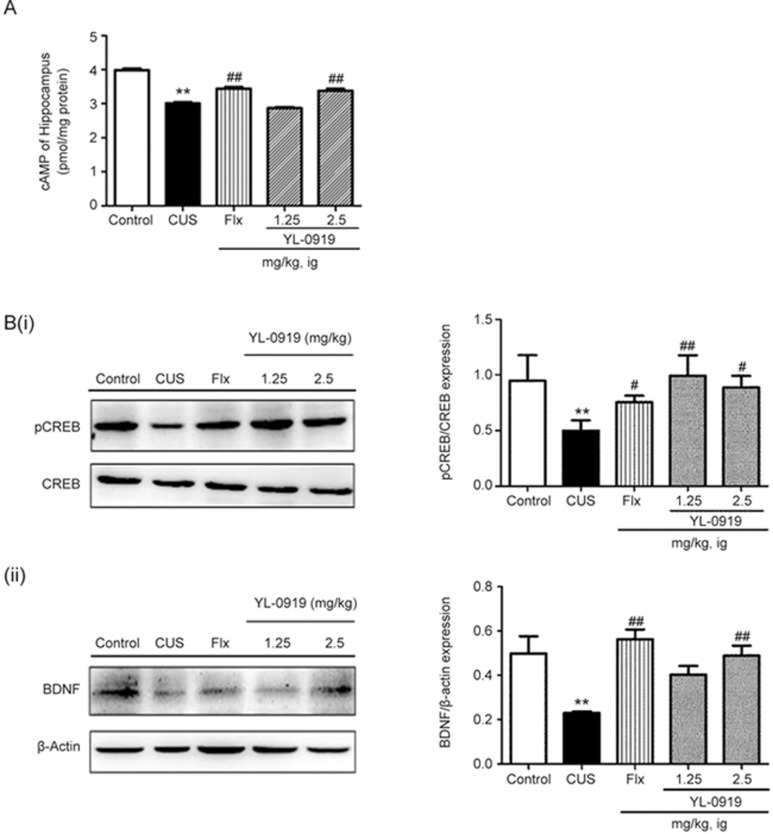
Figure 6.
Effects of YL-0919 on the cAMP concentration (A) and protein expression (B) levels of pCREB/CREB and BDNF in the hippocampus of CUS-induced depressed rats, as determined by ELISA and Western blot analysis, respectively. **P<0.01 indicates significant differences between the control group and the CUS-induced group. ##P<0.01 indicates significant differences between the CUS-induced group and the Flx or YL-0919 (1.25 and 2.5 mg/kg, ig) antidepressant drug treatment groups. Each value represents the mean±SEM. n=8 for ELISA and n=4 for Western blot.

