
Figure 1.
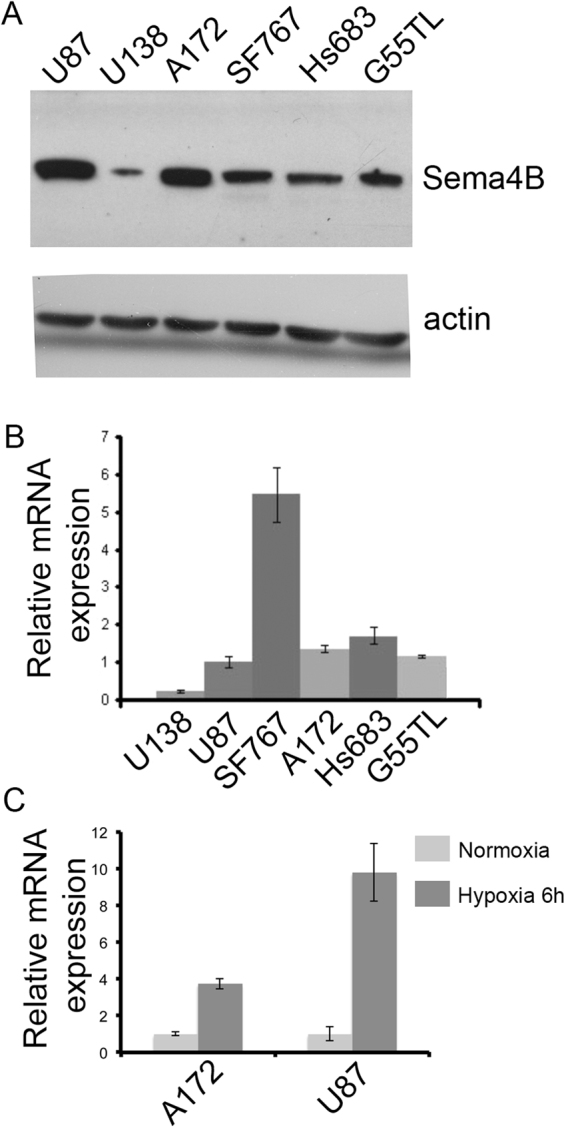
Expression of Sema4B in glioma cell lines. (A) Representative image of a western blot analysis of human glioma cell line extracts reveals expression of Sema4B in all cell lines tested. Actin was used as a loading control. The full-length blots are presented in Supplementary Fig. 3. (B) qPCR analysis of Sema4B mRNA in different glioma cell lines. Data are presented as mean ± s.e.m. (C) qPCR analysis of Sema4B mRNA under conditions of hypoxia. U87-MG and A127 were exposed to 1% or 21% oxygen for 6 h. Data are presented as mean ± s.e.m. The results in (A–C) are representative of three independent repetitions.