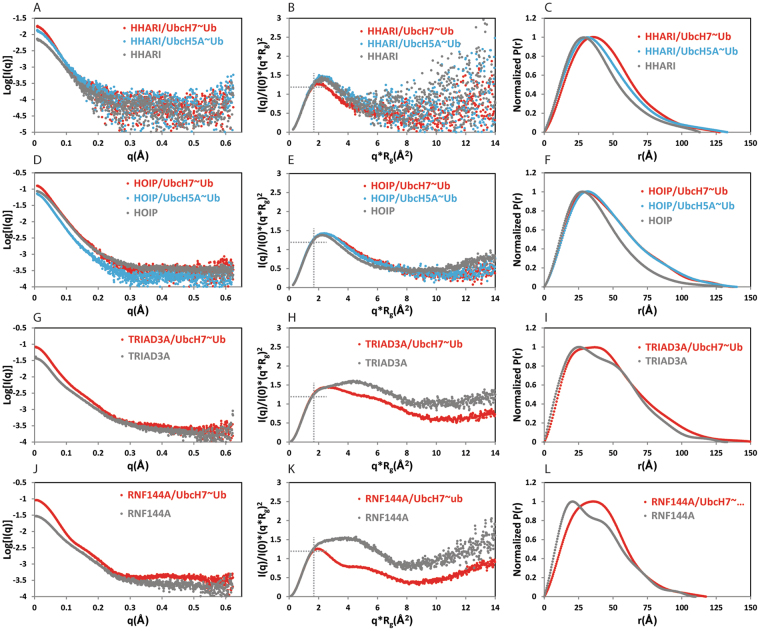
Figure 4.
SAXS analysis of RBRs and their complexes with UbcH7~Ub and UbcH5A~Ub. Solvent-subtracted SAXS curves, Kratky plots and P(r) distributions are reported for HHARI, HHARI/UbcH7-Ub and HHARI/UbcH5A-Ub (A,B,C); HOIP, HOIP/UbcH7-Ub and HOIP /UbcH5A-Ub (D,E,F), TRIAD3A and TRIAD3A/UbcH7-Ub (G,H,I); RNF144A and RNF144A /UbcH7-Ub (J,K,L). The curves of RBRs in isolation are in grey, the curves of the complexes with UbcH7-Ub are in red and complexes with UbcH5A-Ub are in blue.

