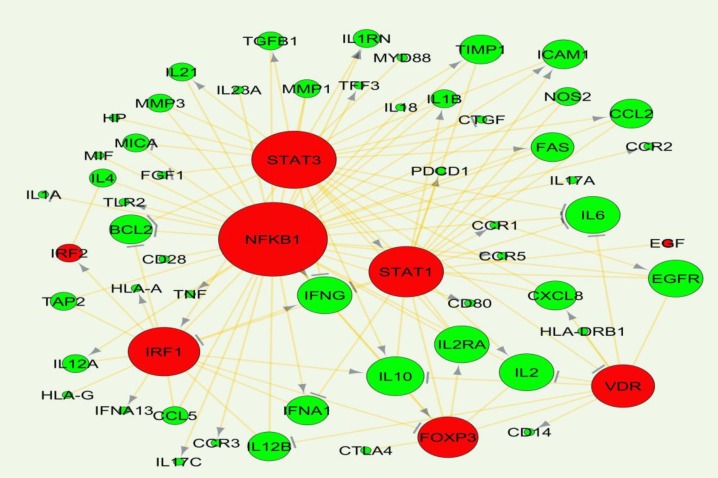
Figure 2.
Interaction network established by common genes underlying celiac disease and hepatitis c. the green and red colors show genes and transcription factors respectively. Network units with more connectivity have been illustrated bigger.→ and ┴ arrows show the activation and repression effects of a TF on the targeted genes respectively

