Fig. 5.
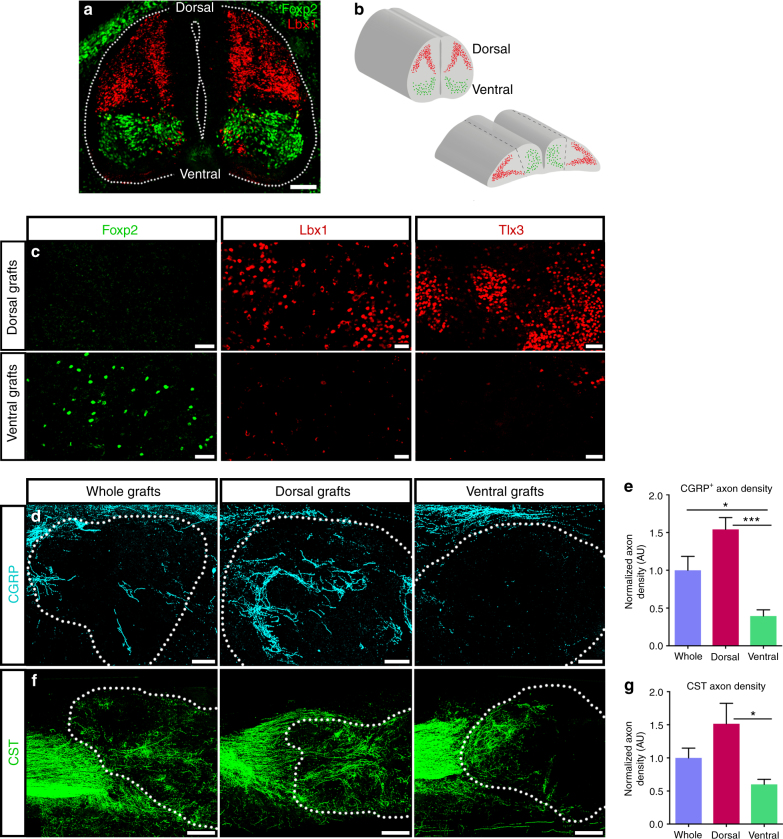
Host corticospinal and CGRP+ axons preferentially innervate dorsal spinal cord NPC grafts. a Transverse image of E14 spinal cord. Lbx1 (red) is expressed in post-mitotic dIL neurons in the dorsal half of the spinal cord, and Foxp2 (green) is expressed in V1 neurons in the ventral half of the spinal cord. b Cartoon illustrating isolation of dorsal and ventral spinal cord NPCs. Top: whole E14 rat spinal cords containing dorsal (red) and ventral (green) NPCs. Bottom: “open-book” E14 spinal cords were separated along the dorsal/ventral boundary (dashed lines) and dorsal or ventral halves of spinal cord were dissociated for grafting. c Representative images from dorsal (top) or ventral (bottom) E14 spinal cord NPC grafts at six weeks following transplantation into sites of C4 dorsal column lesion. Immunoreactivity is shown for ventral interneuron marker Foxp2 (left) and dorsal interneuron markers Lbx1 (middle) and Tlx3 (right). d Representative images of CGRP+ axon (cyan) innervation of whole, dorsal, or ventral spinal cord NPC grafts. Graft boundaries indicated with dotted lines. e Quantification of CGRP+ axon density within whole (n = 5), dorsal (n = 6), and ventral (n = 5) spinal cord NPC grafts at 6 weeks post-transplantation. Mean ± SEM; *p < 0.05, ***p < 0.001 by one-way ANOVA followed by Tukey’s multiple comparisons test. f Representative images of CST axon (green) regeneration into whole, dorsal, or ventral spinal cord NPC grafts at 6 weeks post-transplantation. Graft boundaries indicated with dotted lines. g Quantification of CST axon density within whole (n = 5), dorsal (n = 6), or ventral (n = 5) NPC grafts, normalized to total number of anterogradely-labeled axons in the corticospinal tract rostral to the lesion site. Mean ± SEM; *p < 0.05 by one way ANOVA followed by Tukey’s multiple comparisons test. Scale bars = 250 μm (f), 100 μm (a, d), 50 μm (c)

