
FIGURE 4.
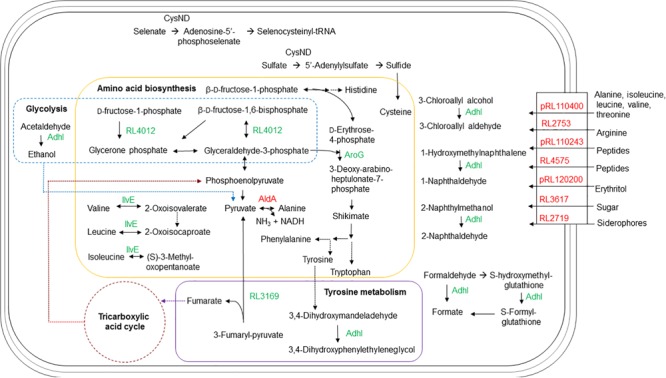
Schematic representation of the metabolic pathways and transport in R. leguminosarum bv. viciae affected by the ctpA mutation. In green are proteins with more abundance in the ctpA mutant and in red proteins have lesser abundance in the ctpA mutant. Solid arrows indicate a single step, while dashed arrows indicate multiple steps.