Figure 2.
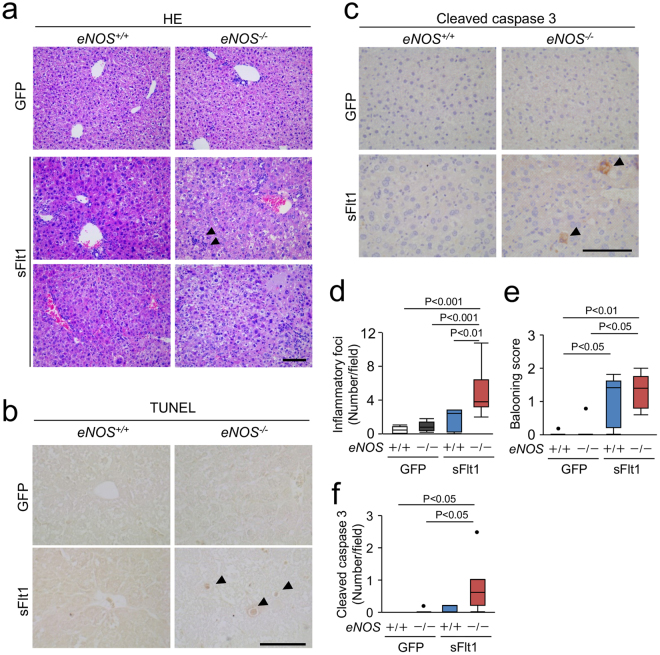
Histological damage in the liver. (a) Representative photomicrographs of Hematoxylin Eosin (HE). Inflammatory foci (arrowheads), vacuolar degeneration, and necrosis are shown in the liver from eNOS −/−; sFlt1 mice. TUNEL (b) and immunohistochemistry against cleaved caspase 3 (c) in the liver. Scale bar indicates 100 µm. (d) The number of inflammatory foci is significantly increased in the liver from eNOS −/−; sFlt1 mice. (e) The score of ballooning hepatocytes. (f) Increased cleaved caspase 3 positive cells in the liver from eNOS −/−; sFlt1 mice. n = 5–8. Data are shown as box plot. ANOVA or Kruskal-Wallis test.

