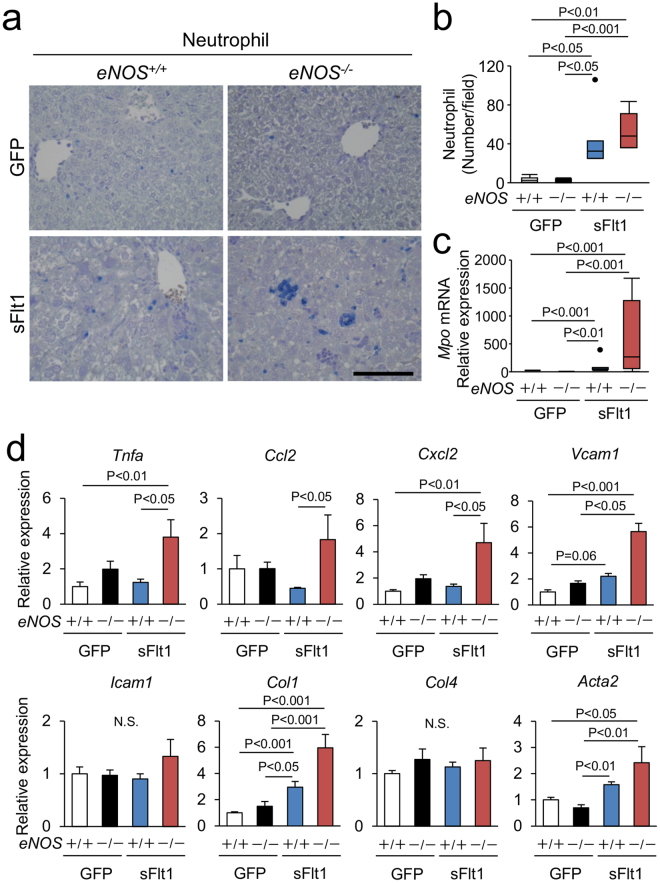
Figure 3.
Inflammation in the liver. (a,b) Infiltrating neutrophils are visualized by Naphthol AS-D chloroacetate Esterase stain (blue). Scale bar indicates 100 µm. Number of neutrophil is increased by excessive sFlt1, which is further up-regulated by eNOS deletion. (c) The level of Mpo (myeloperoxidase) mRNA drastically increased in the liver from eNOS −/−; sFlt1 mice. (d) Expression of inflammation and pro-fibrotic related genes in the liver. N.S., not significant. n = 7–8. Data are shown as mean ± s.e.m or box plot. ANOVA or Kruskal-Wallis test.

