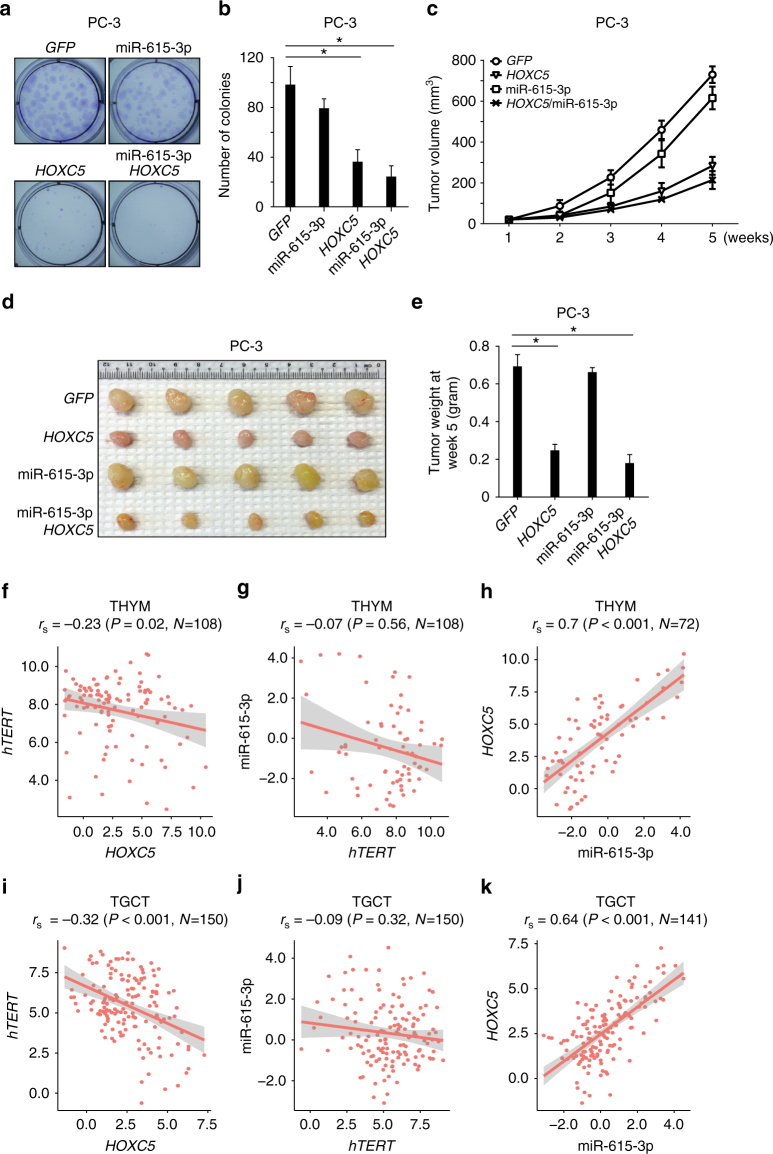
Fig. 7.
HOXC5 suppresses hTERT expression and inhibits cancer cell growth. Representative images (a) and quantification (b) of in vitro colony formation assay in PC-3 cells expressing GFP, mir-615-3p, HOXC5 or both HOXC5 and mir-615-3p. Tumor growth curve (c) representing images (d), and tumor weight (e) showed growth of xenograft tumors in NSG mice injected with PC-3 cells expressing GFP, mir-615-3p, HOXC5 or both HOXC5 and mir-615-3p in vivo. Significance was determined by t test. *P < 0.05. Scatterplots showing Spearman correlation between hTERT and HOXC5 (f, i); miR-615-3p and hTERT (g, j); HOXC5 and miR-615-3p (h, k) in THYM (top) and TGCT (bottom) cancer samples. Red line indicates the linear fit with 95% confidence interval in shaded gray. All values are in RSEM log2 units. TGCT testicular germ cell tumor; THYM thymoma

