Figure 4.
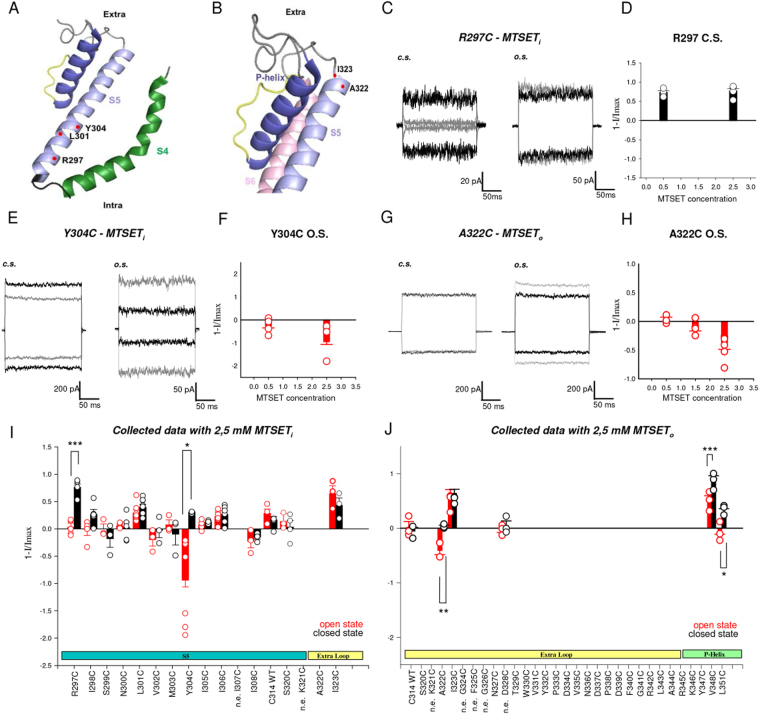
Cysteine scanning mutagenesis shows a state dependent accessibility of S5. (A) Mapping CNGA1 residues on TAX-4 structure (PDB ID: 5H3O) shows the location of key residues in the intracellular portion of S5. (B) as in (A) but for extracellular portion of S5. Key residues are highlighted with red spheres. Different regions (S4–S5 and P-helix) are illustrated in different colours. (C) Comparison between the cGMP-activated currents at ± 60 mV for the mutant channels R297C before (black) and after (grey) 3 minutes application of 2.5 mM MTSET to the intracellular side (MTSET i) in the closed (c.s.) and open (o.s.) states. (D) Plot representing the comparison of MTSET i at different concentration (n = 4 for 0.5 mM and n = 5 for 2.5 mM) in the closed state for mutant channels R297C; histograms are the average ± s.e.m. and circles indicate data from single experiments. (E) as in (C) but for the mutant channels Y304C. (F) as in (D) but for the mutant channels Y304C in the open state (n = 4 for 0.5 mM and n = 7 for 2.5 mM). (G,H) as in (E) and (F) but for the mutant channels A322C with the addition of 2.5 mM MTSET to the extracellular side (MTSET o) and with different concentration of MTSET (n = 3 for 0.5 mM, n = 4 for 1.5 mM and n = 7 for 2.5 mM). (I,J) Histograms representing the average ± s.e.m. for many mutant channels, circles indicate data from single experiments after the application of 2.5 mM MTSET in the open (red) and closed (black) states. The number (n) of experiments for different mutant channels in different states varies between 3 and 8 (see also Supplementary Table 2). (n.e.) represents mutant channels without expression. Significativity is shown only for mutants where the MTSET effect was >30%. Unpaired two–tail T-test in i for R297C and Y304C: t7 = −7,529, P < 0.001; t8 = −2,649; P < 0.05. Unpaired two–tail T-test in j for A322C, V348C and L351C: t8 = −3,668, P < 0.01; t12 = −4,544, P < 0.001; t6 = −3,109, P < 0.05. Further statistical tests for these mutant channels and for all other tested mutants are reported in Supplementary Table 2c,d. 1-I/Imax represents the normalized current where I is the residual current measured in the presence of 1 mM cGMP after application of MTSET (in different conditions) and Imax is the cGMP-activated current at the beginning of the experiment.

