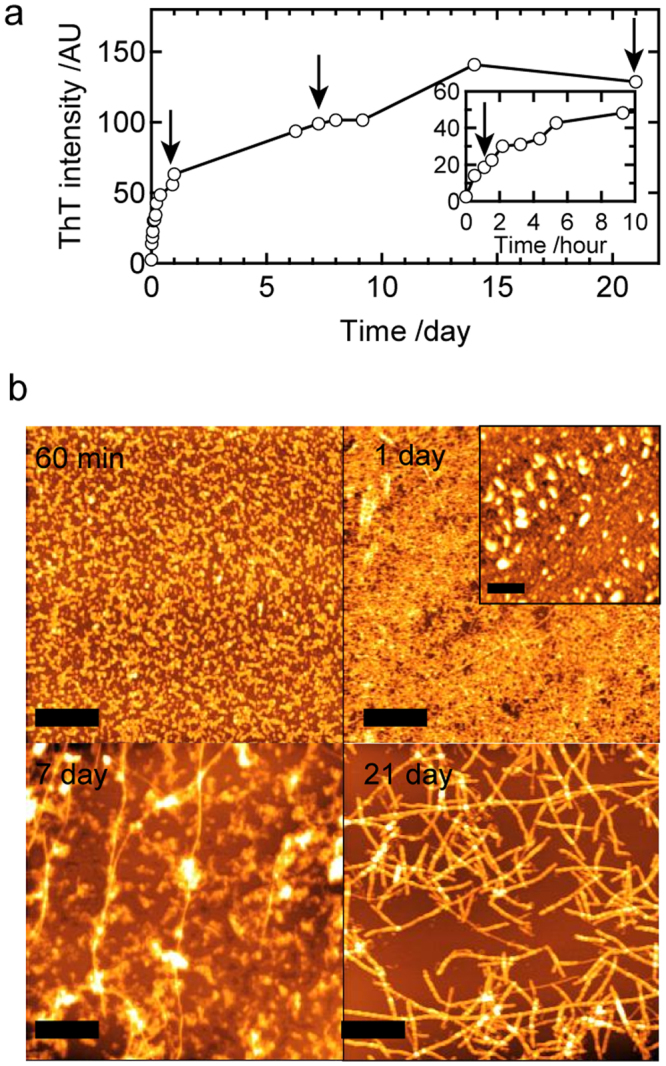
Figure 3.

Time course of amyloid fibril formation by the B chain at pH 8.7 under non-agitated conditions. (a) Time course of ThT fluorescence intensity. A magnified view of the early time region is also shown as an inset. The arrows indicate time points where AFM samples were collected. (b) Corresponding time dependence of aggregation, as monitored by AFM images. The inset is an AFM image sampled without washing by water, which was observed at 510 min. The scale bars in AFM images represent 1 μm.
