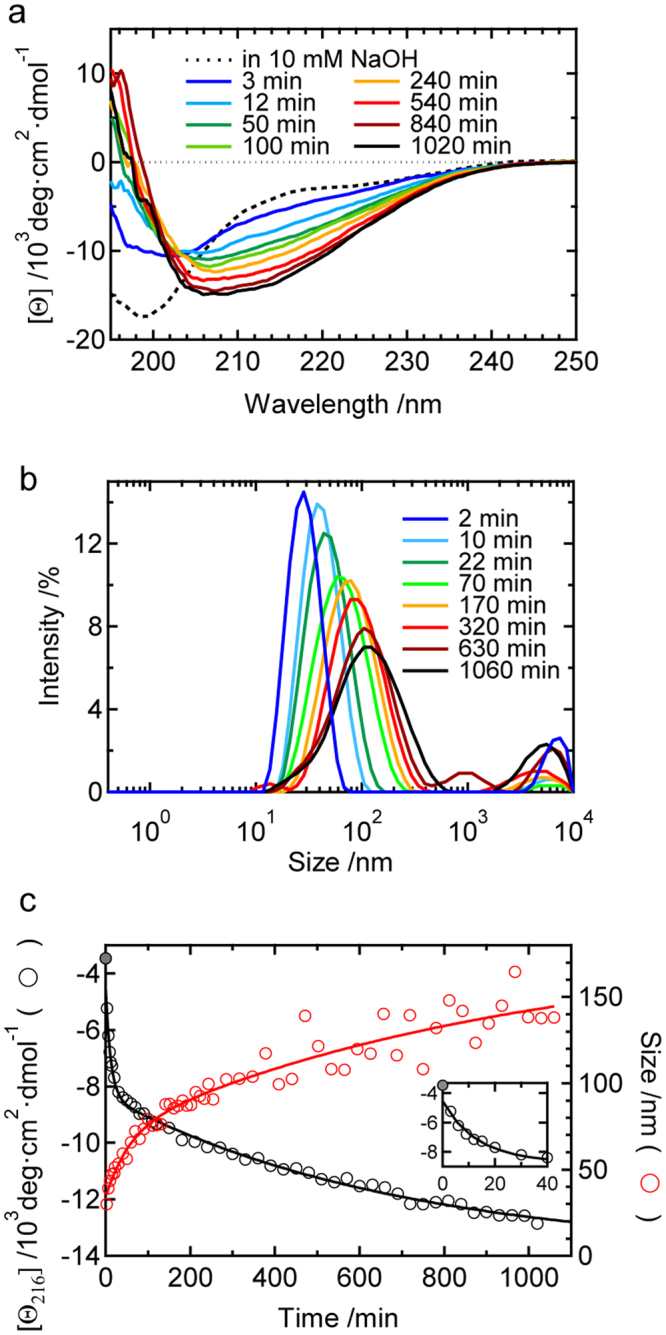
Figure 4.

Formation and time evolution of the structure and size of prefibrillar aggregates as monitored at pH 8.7 under non-agitated conditions. Time-dependent changes in (a) CD spectra and (b) DLS size distributions. In panel a, the spectrum obtained in 10 mM NaOH is also shown by a dashed line as a reference. (c) Time course of molar ellipticity at 216 nm ([θ 216]) and the position of the main peak in the size distribution of DLS. The black and red continuous lines show the fit curves obtained using equations 2 or 5, respectively. The inset shows a magnified view of the early time of the CD time-course plot.
