Figure 6.
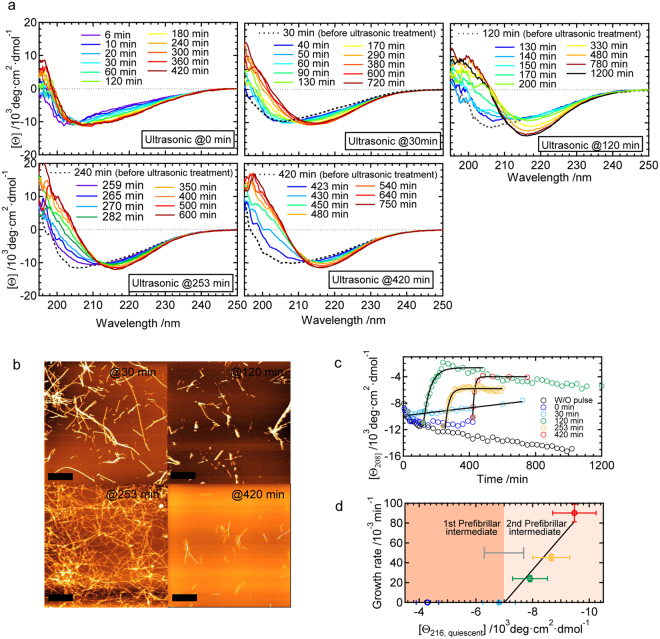
Effects of the ultrasonic pulse treatment on prefibrillar intermediates. (a) Time-dependent changes in CD spectra after the ultrasonic treatment. The results of five different timings of the ultrasonic treatment are shown. Except for the panels of ultrasonication at 0 min, CD spectra measured before the ultrasonic treatment are also shown by dashed lines as references. (b) AFM images of final reaction products obtained by analyses of the ultrasonic treatment at 30, 120, 253, and 420 min. The scale bars in AFM images indicate 1 μm. (c) Summary of the time dependency of CD spectral changes after the ultrasonic treatment, which was represented by plotting molar ellipticity at 208 nm ([θ 208]) against time. Values without the ultrasonic treatment (W/O pulse) were taken from the data shown in Fig. 4a. The black continuous lines show fit curves assuming a single exponential function. (d) Relationship between the fibril growth rate obtained by curve fitting in panel c and the molar ellipticity at 216 nm just before the ultrasonic treatment ([θ 216, quiescent]). The growth rate observed by the 0-min treatment was defined as zero because of the lack of fibril growth within our observation time. Two phases for the 1st prefibrillar intermediate and 2nd prefibrillar intermediate are colored separately based on the asymptotic values of molar ellipticity (i.e. [θ]1 and [θ]2), which were obtained by the curve fitting of the CD time-course measurements in the quiescent conditions. The error bars were obtained by calculation based on the standard deviations for the three independent measurements.

