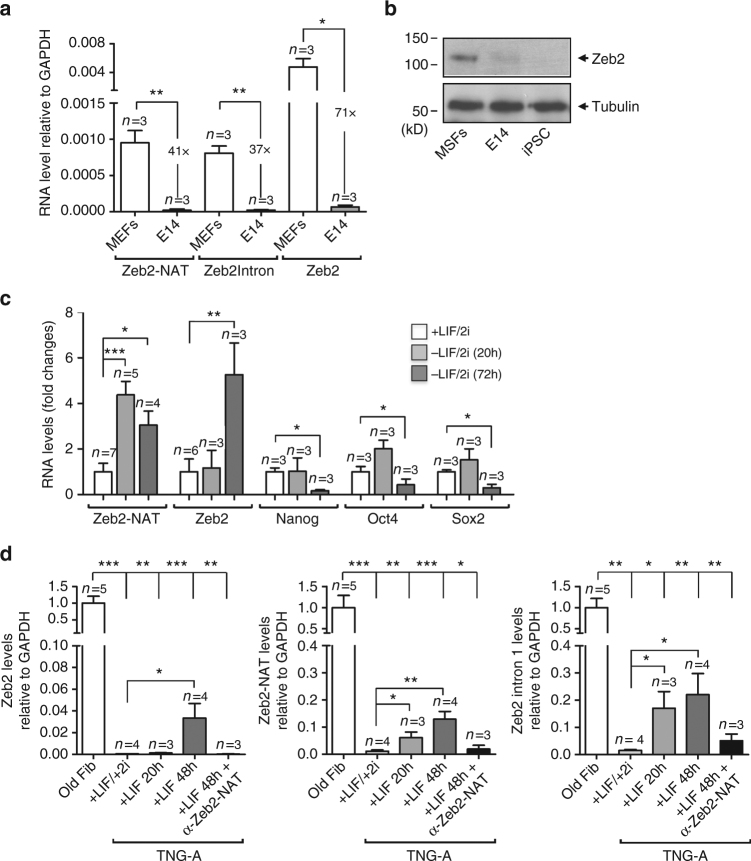
Fig. 6.
Zeb2-NAT expression in ES cells increases in response to differentiation stimuli. a qRT-PCR analysis of Zeb2-NAT and Zeb2 transcripts in MEFs and in the embryonic stem cell line E14. b Immunoblot for Zeb2 and tubulin in total cell lysates from MSFs (mouse skin fibroblasts), E14 cells and iPSCs. c qRT-PCR analysis of the indicated transcripts in E14 cells cultured in medium with LIF/2i or incubated for 20 and 72 h after removal of LIF and 2i. d qRT-PCR analysis of the indicated transcripts in old fibroblasts and TNG-A cells grown in the presence or absence of 2i. For all graphics depicted, Student’s t test (two-tailed) statistics was used, *p < 0.05, **p < 0.01, ***p < 0.001; error bars represent standard deviation; n=experiments with independent cell cultures

