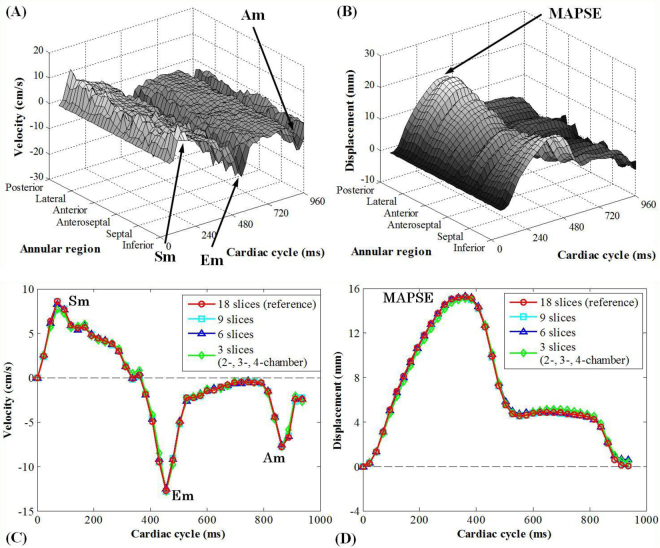
Figure 2.
Mitral annulus dynamics obtained by feature tracking. In (A,B), the MA velocity and displacement were plotted as a function of annular region and cardiac cycle for all radially rotational slices and cardiac phases. In (C,D), the spatially averaged velocity and displacement curves were plotted along the cardiac cycle for 18, 9, 6, and 3 slices, respectively. For the 3-slice version, the clinical routine 2-, 3- and 4-chamber views were chosen. Data were obtained from a 39-year-old male normal control. Sm: peak systolic velocity; Am: peak late diastolic velocity; Em: peak early diastolic velocity; MAPSE: mitral annular plane systolic excursion.

