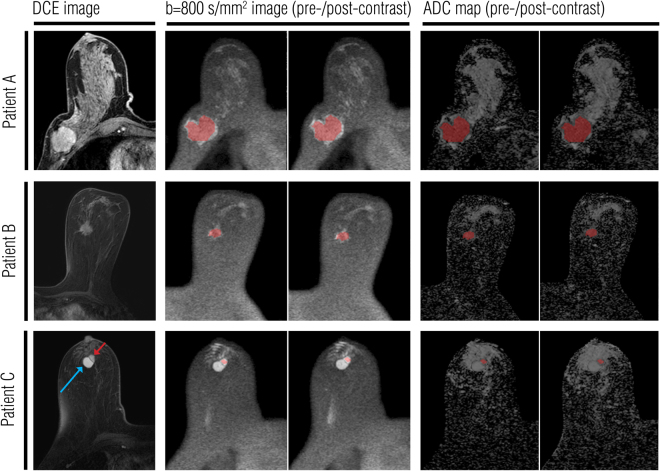
Figure 1.
Pre- and post-contrast ADC measurements in three illustrative lesions. The lesions were first localized using T1-weighted, T2-weighted and dynamic contrast enhanced (DCE) images (DCE images shown in the left column). A whole lesion covering region of interest (ROI) was drawn on the pre-contrast b = 800 s/mm2 image. This ROI was then replicated on pre- and post-contrast ADC maps. Images in the right column show ROIs on the pre- and post-contrast ADC maps that were generated using the b values of 0, 200, 400, 600, and 800 s/mm2. (A) A large ductal carcinoma of 47 mm in diameter in the right breast. (B) A ductolobular carcinoma of 21 mm in diameter in the left breast. (C) An intraductal papilloma (red arrow) of 13 mm in diameter in the right breast. A circumscribed, oval hemorrhagic cyst (blue arrow) was detected lateral to the enhancing mass.

