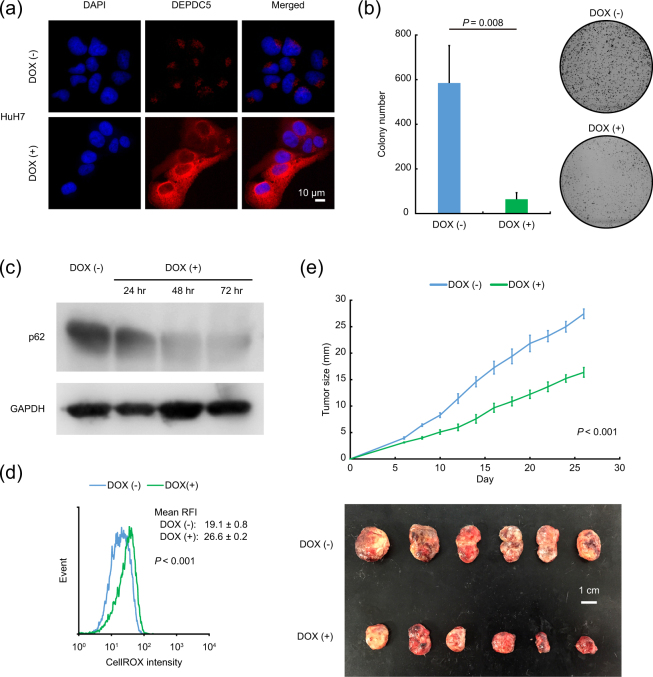
Figure 4.
Inhibition of cancer cell growth with elevated cellular ROS levels by DEPDC5 overexpression. (a) Immunofluorescence analysis of the doxycycline (DOX)-inducible DEPDC5-expressing HuH7 cells with DEPDC5 staining (red). Nuclei were counterstained with DAPI (blue). Magnification, ×200. (b) Quantification of colony-forming efficiency. Error bars are the mean ± S.D. P values were calculated by Welch’s t-test. (c) Immunoblots of p62. The cells were exposed to medium containing doxycycline for the indicated time periods. GAPDH was used as a loading control. (d) Representative histogram images of cells with CellROX. The value of each mean RFI is the mean ± S.D. P values were calculated by Welch’s t-test. (e) In vivo tumorigenicity of doxycycline-inducible DEPDC5-expressing HCC cells. The upper and lower panels show growth curves of transplanted tumors and representative photo images. Error bars are the mean ± S.E in the upper panel. P values were calculated by Welch’s t-test. The white scale bar is 1 cm in the lower panel.

