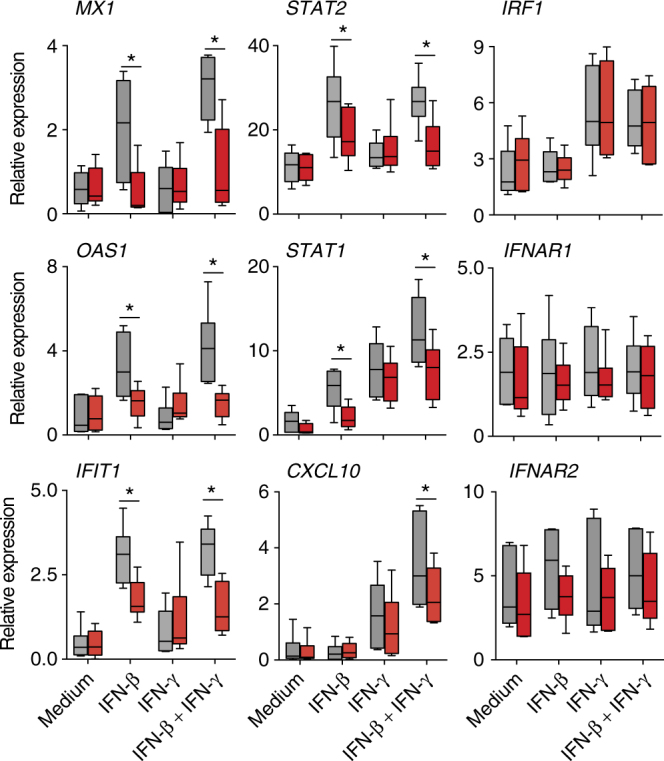
Fig. 3.

TCC/Del genotype PBMCs have reduced response to type I but not type II IFN. PBMC with TCC/TCC (gray) or TCC/Del (red) genotype were stimulated with IFN-β or IFN-γ or both (at 100 U/ml) for 6 h and gene expression analyzed using qRT-PCR. The data shown are the median and range (n = 6/genotype) of mRNA expression relative to GAPDH. Box plots represent the median (solid line within the box) and 25th and 75th percentile. The whiskers indicate minimal and maximal values
