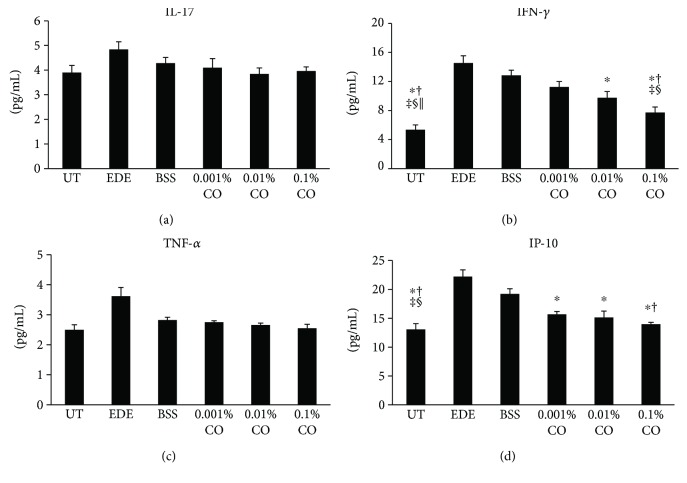
Figure 5.
Concentrations of interleukin- (IL-) 17 (a), interferon- (IFN-) γ (b), tumor necrosis factor- (TNF-) α (c), and IFN-γ-inducible protein- (IP-) 10 (d), in the conjunctiva of the untreated (UT) control, experimental dry eye (EDE), balanced salt solution (BSS), and 0.001%, 0.01%, and 0.1% Chamaecyparis obtusa (CO) extract groups. ∗P < 0.05 compared with the EDE group. †P < 0.05 compared with the BSS group. ‡P < 0.05 compared with the 0.001% CO extract group. §P < 0.05 compared with the 0.01% CO extract group. ||P < 0.05 compared with the 0.1% CO extract group.

