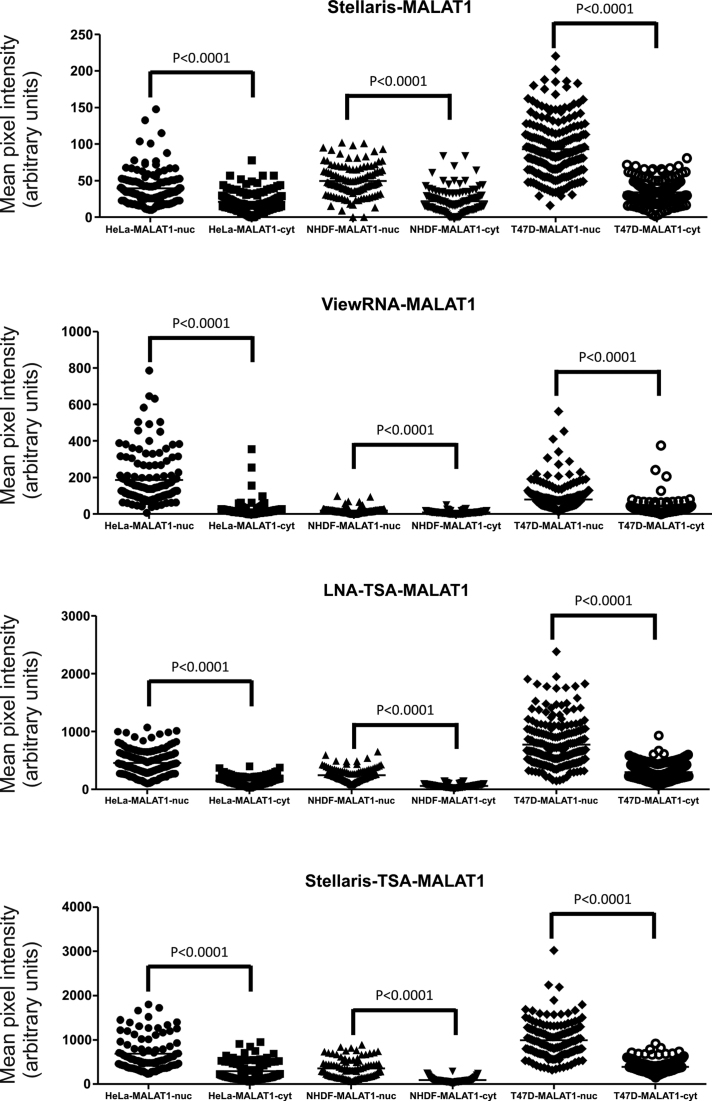
Figure 3.
Comparative quantification of MALAT1 in HeLa, NHDF and T47D cells using four different ISH methods. Quantification of signal intensity in individual cells is depicted as a vertical scatter plot. Each individual dot represents the signal of the mean pixel intensities in the nucleus (nuc) and the cytoplasm (cyt), respectively, of individual cells recorded from images acquired at identical exposure times across the different cell lines and the different ISH methods. The statistical differences of the MALAT1 signal in the nuclei and the cytoplasm were determined using a paired t-test.

