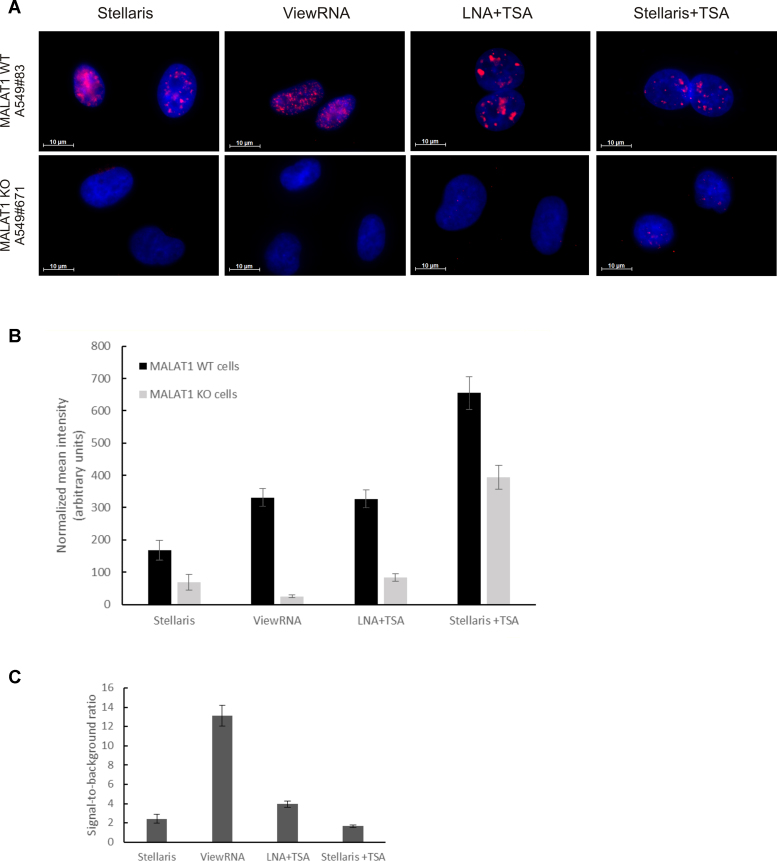
Figure 4.
Analysis of MALAT1 ISH methods in MALAT1 knock-out cell lines. (A) Images of the ISH signal (red stain) for MALAT1 in the A549 WT and in the MALAT1 knock-out cell line A549#671 using Quasar 570-labeled and FAM-labeled Stellaris probes, bDNA (ViewRNA), and LNA probes as indicated. Cells were counter-stained with DAPI (blue stain). Images were acquired at the same exposure conditions. Scale bar: 10 μm. (B) Depiction of the average nuclear ISH signal obtained with the different ISH methods in three A549 wild-type clones (WT, #10, #83) and three A549 MALAT1 knock-out cell lines (#671, #752, #772). The diagram shows the mean intensity of the nuclear MALAT1 signal measured against the mean intensity of the cytoplasmic ISH signal in each individual cell. Data represents average ± SEM of two experiments (n ≥ 30 cells for each condition/experiment). (C) Depiction of the ratio between the average nuclear signals obtained in A459 MALAT1 WT cells and in the MALAT1 knock-out A549 cells using the four different ISH-methods.

