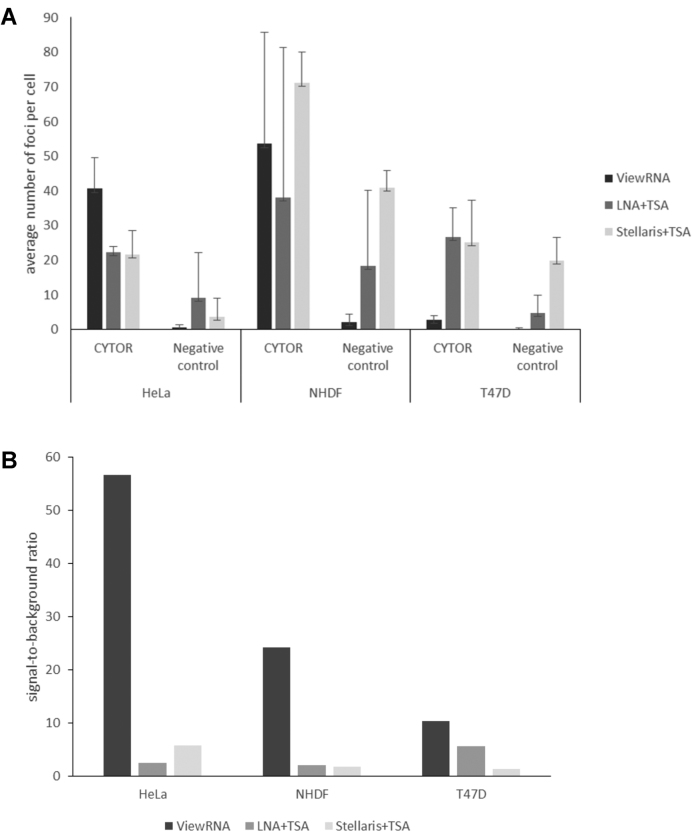
Figure 6.
Comparative quantification of CYTOR detection in HeLa, NHDF and T47D cells using three different ISH methods. (A) The average number of ISH signal foci per cell were obtained with the CYTOR probes (ViewRNA, LNA + TSA and Stellaris + TSA) and the respective negative control probes (bacterial dapB ViewRNA probe, scramble LNA probe and murine TNFα Stellaris probe). (B) The average signal-to-noise ratio of the three different ISH methods in the three cell lines are depicted by dividing the CYTOR signal with the signal of the respective negative control probes.

