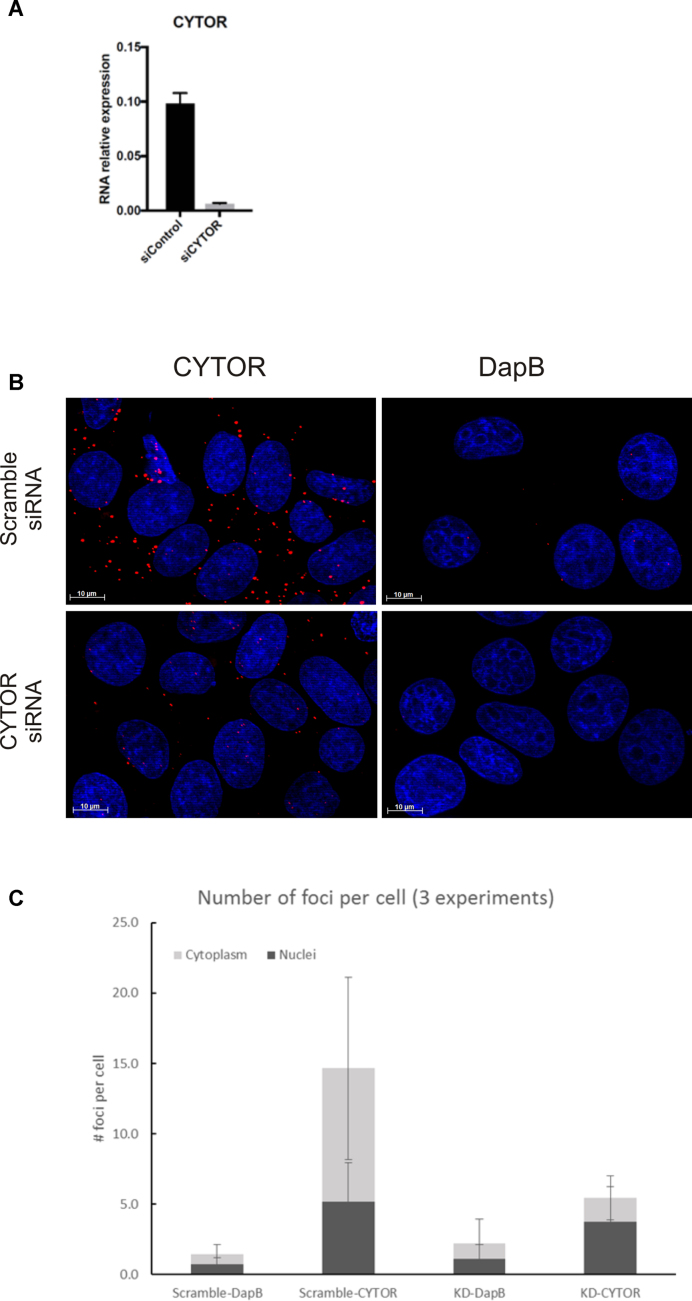
Figure 7.
Evaluation of CYTOR ISH in CYTOR knock-down cell lines. (A) RT-qPCR measurements of CYTOR expression in MCF7 cells transfected with a siRNA with a scramble sequence or against CYTOR. GAPDH mRNA levels were used to normalize gene expression. (B) CYTOR ISH signal (red stain) and dapB ISH signal (negative control) in MCF7 cells transfected with scramble- or CYTOR-specific siRNA. Cells were counter-stained with DAPI (blue stain), scale bar: 10 μm. (C) Quantification of the CYTOR ISH signal (number of positive spots or foci per cell) in the nucleus and in the cytoplasm of the siRNA treated cells. Data represents average ± SEM of at least three experiments (n ≥ 30 cells for each condition/experiment).

