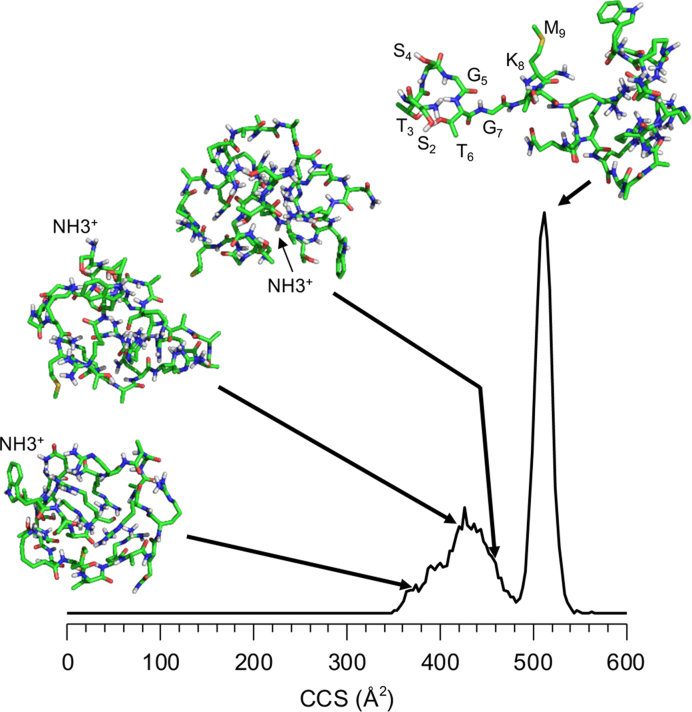
Figure 3.
Molecular dynamic simulations of the NTA peptide. Selected conformations are shown, drawn to their calculated cross section in the distribution. The N-terminus of each structures is labeled. The sharp peak at 509 Å2 shows that the N-terminal eight residues of B25 is exposed to the solution. This feature was induced by simulating heating of the peptide to cause the unfolding of the peptide.

