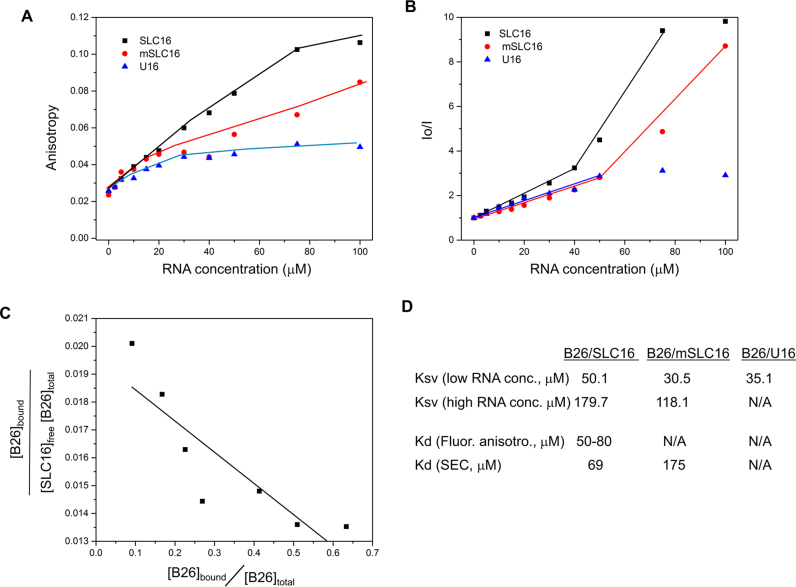
Figure 4.
B25 preferentially binds SLC16 in solution. (A) Fluorescence anisotropy of B26 with RNAs. The complex of B26 with SLC16 (black squares), mSLC16 (red circles) and U16 RNA (blue triangles) were measured with increasing concentrations of the RNA and a fixed concentration of B26 (5.0 μM). All measurements were obtained at ca. 22°C. (B) Quenching of the fluorescence signal of B26 by RNA. Both SLC16 and mSLC16 showed two distinct phases of quenching, which is not observed with U16 RNA. The slope of each linear plot corresponds to the Stern–Volmer constant (Ksv) for the B26–RNA interactions. (C) Scatchard plot based on B26–SLC16 anisotropy measurements. The data from 5 to 50 μM that show appreciable change in anisotropy was used. The fraction of the bound B26 was calculated based on the assumption that the binding being one to one. Saturation value of anisotropy of bound B26 is 0.11 and for unbound B26 is 0.024. The slope of the equation corresponds to −1/Kd and its Y-axis corresponds to 1/Kd. The Kd values were calculated from both parameters. (D) Dissociation constants (Kd) were calculated based on fluorescence anisotropy as well as SEC and Ksv (10−3 μM−1) for B26-RNA interactions. Low-RNA concentration ranges from 2.5 to 40 μM, while high RNA concentration ranges from 40 to 100 μM. Kd is not available for B26-mSLC16 and B26–U16 from the anisotropy measurement since their saturated values were not available. The Kd from SEC was not determined for B26–U16 mixture since the peak area of the B26–U16 complex was negligible.

