Figure 5.
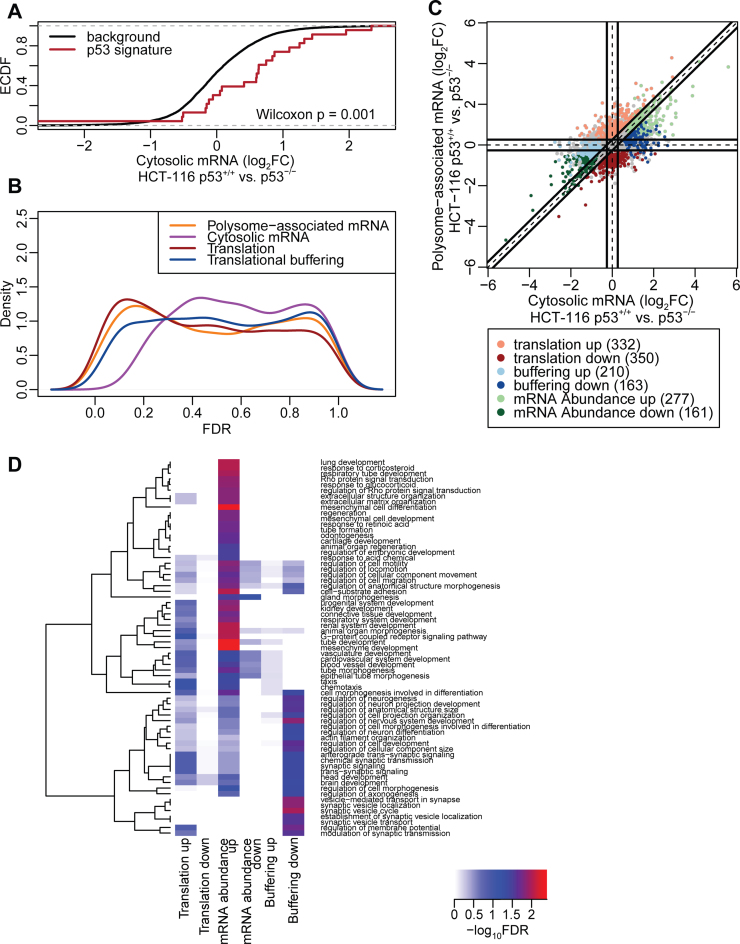
Analysis of the p53 translatome of HCT-116 cells using an optimized non-linear gradient. (A) Cumulative distributions of fold-changes for cytosolic mRNA between HCT-116 p53+/+ and HCT-116 p53−/− cells for all genes (background) and a set of genes described as transcriptionally induced by p53. (B) Densities of FDRs for analysis of polysome-associated mRNA, cytosolic mRNA and changes in translational efficiency affecting protein levels or buffering (HCT-116 p53+/+ versus HCT-116 p53−/− cells). (C) Scatter plot of polysome-associated mRNA log2 fold changes versus cytosolic mRNA log2 fold changes. Regulated are indicated. (D) Heatmap showing GO term enrichment among genes regulated via abundance (i.e. congruent changes in cytosolic and polysome-associated mRNA) or genes whose translational efficiency affects protein levels or buffering. –log10 FDR of the hypergeometric tests are colour-coded in the heatmap and an unsupervised clustering was applied to GO terms. FDR = False Discovery Rate; FC = Fold Change.

