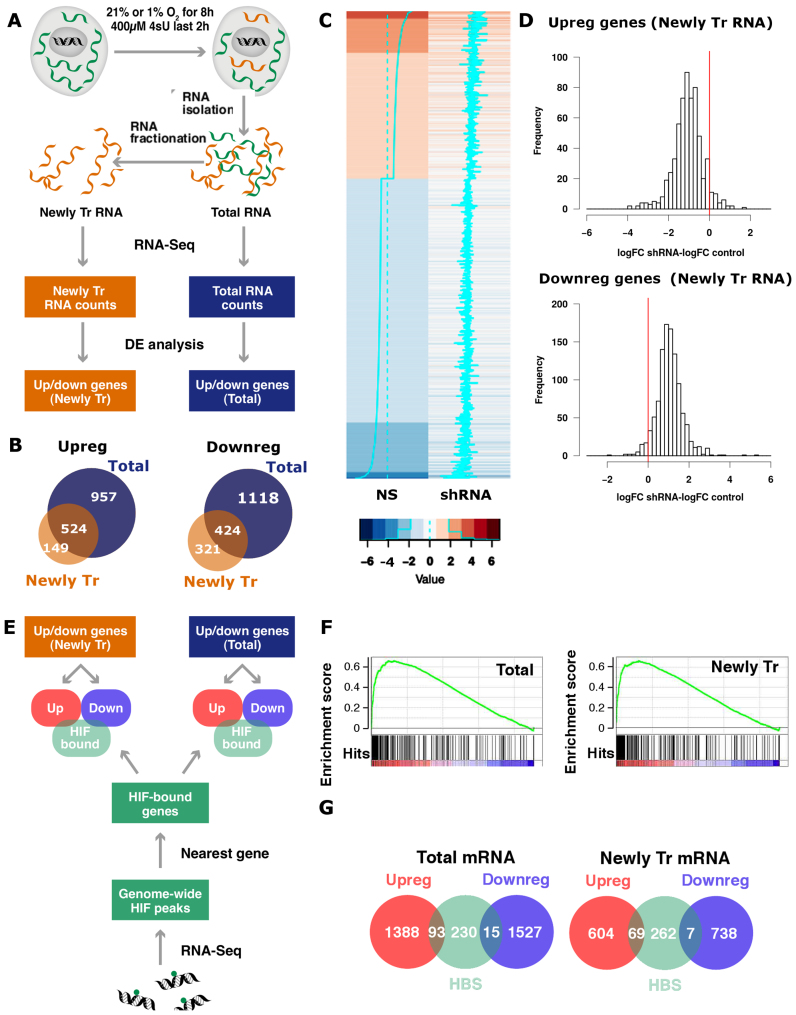
Figure 1.
Identification of the transcriptional component of the hypoxia-induced gene expression pattern. (A) Exponentially growing non-synchronized HUVEC were exposed to 21 or 1% oxygen for 8 h and pulse labeled with 4sU prior RNA extraction. An aliquot of each RNA sample was kept (Total RNA) and the rest was processed to isolate the newly transcribed (4sU-labeled) RNA pool. Poly-A RNA was purified from each of the three fractions (total, 4sU-labeled and pre-existing RNA), analyzed by high-throughput sequencing and quantified by mapping reads to the exonic regions of genes (RNAseq). The results shown derive from three independent biological replicas, each using a different pool of HUVEC donors. (B) Venn diagrams representing the number of genes significantly (FDR < 0.05) up- or downregulated shared by the total (blue circles) and newly transcribed (orange circles) fractions. (C and D) Control (NS) and EPAS1-silenced (shRNA) HUVEC were exposed to 1% oxygen for 16 h, pulse labeled with 4sU and the newly transcribed mRNA fraction from each sample was analyzed by RNAseq. The results shown derive from a single biological replica. The treatment with shRNA reduced the expression of EPAS1 to 17% of control values. (C) Heatmap representing the log-fold change (logFC) expression in hypoxia over normoxia in control (‘NS’) and EPAS1 knockdown cells. (‘shRNA’) for all transcripts affected by hypoxia (absolute logFC > 1). Each row represents a transcript in a color code that indicates their response to hypoxia (upregulated genes in red and downregulated in blue) and the magnitude of change as shown indicated in the legend below the heatmaps. The cyan lines also indicate the magnitude of the fold change for a particular transcript, and the dotted line indicates no change in expression. (D) For each gene whose expression up- (logFC > 1, top panel) or downregulated (logFC < −1, bottom panel) by hypoxia in control cells, we computed the difference between the changes induced by hypoxia in EPAS1-silenced cells and control cells, that is the logFC observed in EPAS1-silenced cells minus logFC observed in controls (‘logFC shRNA-logFC NS’). The red line indicates a difference value of zero, which would be expected in the case of lack of effect of the interference. The mean of the differences was significantly different of zero in all the cases (single sample student’s t-test, P < 0.001). (E) HUVEC were exposed to 1% oxygen for 16 h and then processed to determine ARNT and EPAS1 binding sites by ChIP-Seq. Regions bound by HIF were assigned to the nearest gene and compared to mRNAs significantly up- (‘Upreg.’) or downregulated (‘Downreg.’) by hypoxia in the total and 4sU-labeled fractions from part A. (F) The genes detected by RNA-seq in total (left graph) and newly transcribed fractions (right graph) were sorted according to their response to hypoxia (from strongly induced on the left, labeled in red color, to strongly repressed on the right, labeled in blue color) and distribution of EPAS1 binding sites across these ranked lists of genes was analyzed by Gene Set Enrichment Analysis (GSEA). HIF binding sites were significantly enriched (FDR < 0.01) in the genes whose expression was induced by hypoxia in both mRNA fractions. (G) Venn diagrams representing the number of genes significantly (FDR < 0.05) up- (red circles) or downregulated (blue circles) by hypoxia that present a HIF binding site (HBS, green circles). The same analysis was performed for genes differentially expressed in the total mRNA (left graph) and 4sU-labeled (right graph) fractions. The proportion of genes showing HIF binding sites was significantly different for the up- and downregulated categories (two-proportion test, P < 0.001).

