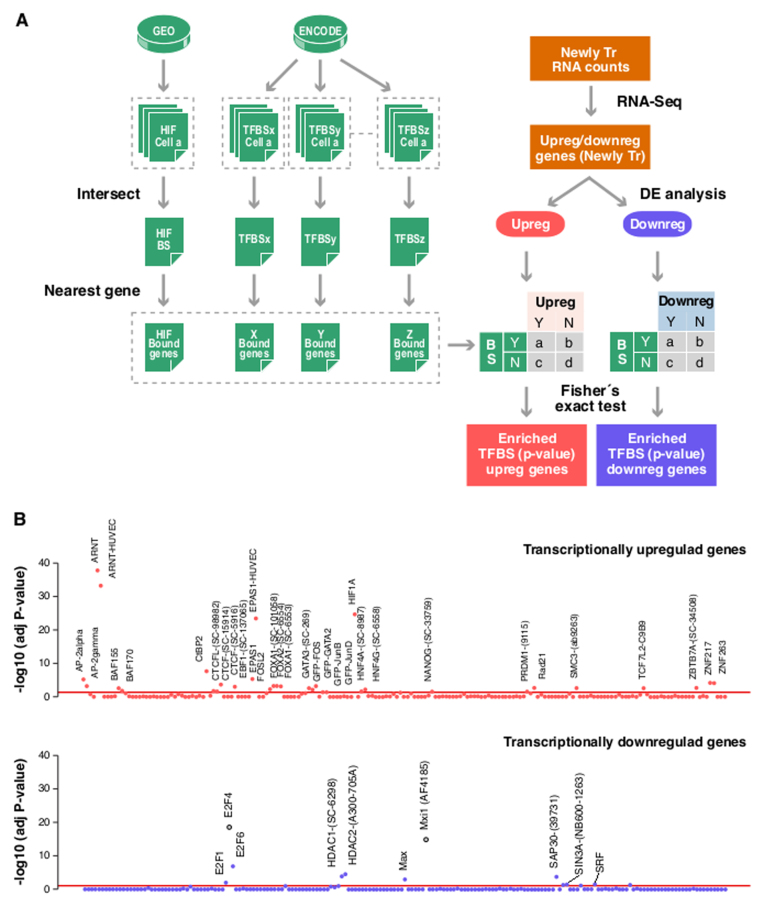
Figure 2.
TF binding sites over-represented in genes regulated by hypoxia. The presence of binding sites for each one of the 166 factors (‘TFBSx’, ‘TFBSy’,…‘TFBSz’) assayed by the ENCODE project and HIF binding sites determined elsewhere (‘HIF’) as determined for each of the genes whose transcription is significantly modulated by hypoxia in HUVEC cells (‘Newly Tr. RNA counts’). For factors assayed in more than one cell line by ENCODE, we only considered those peaks present in all cell types. For each TF we assigned binding sites to the nearest gene. For association studies, genes were categorized according to their response to hypoxia into up- or downregulated sets and the distribution of binding sites for each factor in each set was compared to that expected by chance by Fisher exact test. The resulting P-values were adjusted for multiple testing. (A) Schematic diagram depicting the analysis strategy. (B) The figure shows the association between binding for each of the analyzed factors (x-axis) and the induction (upper graph) or repression (bottom graph) of the nearest genes. Each dot represents the FDR-adjusted P-value obtained in the Fisher’s for a single factor. Red line correspond to an adjusted P-value of 0.05. The identity of the factors significantly over-represented is indicated.

